. 2023 Jan 17;12(2):217.
doi: 10.3390/antiox12020217.

Aging-Associated Thyroid Dysfunction Contributes to Oxidative Stress and Worsened Functional Outcomes Following Traumatic Brain Injury

Affiliations

Aging-Associated Thyroid Dysfunction Contributes to Oxidative Stress and Worsened Functional Outcomes Following Traumatic Brain Injury

Cheng-Ta Hsieh et al. Antioxidants (Basel). .

Abstract

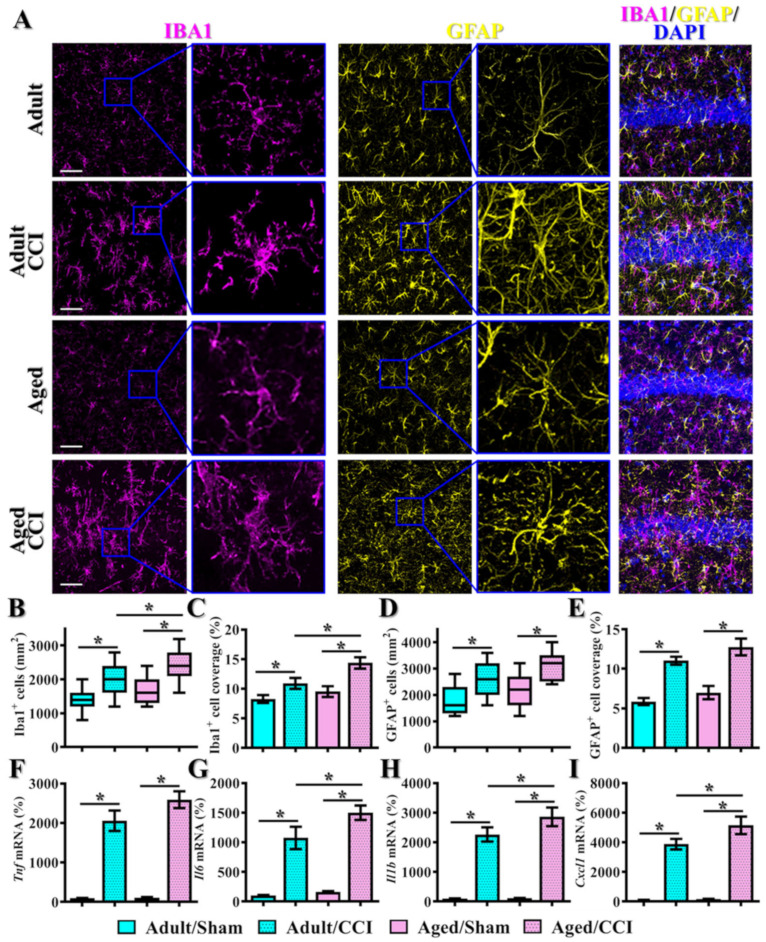
The incidence of traumatic brain injury (TBI) increases dramatically with advanced age and accumulating evidence indicates that age is one of the important predictors of an unfavorable prognosis after brain trauma. Unfortunately, thus far, evidence-based effective therapeutics for geriatric TBI is limited. By using middle-aged animals, we first confirm that there is an age-related change in TBI susceptibility manifested by increased inflammatory events, neuronal death and impaired functional outcomes in motor and cognitive behaviors. Since thyroid hormones function as endogenous regulators of oxidative stress, we postulate that age-related thyroid dysfunction could be a crucial pathology in the increased TBI severity. By surgically removing the thyroid glands, which recapitulates the age-related increase in TBI-susceptible phenotypes, we provide direct evidence showing that endogenous thyroid hormone-dependent compensatory regulation of antioxidant events modulates individual TBI susceptibility, which is abolished in aged or thyroidectomized individuals. The antioxidant capacity of melatonin is well-known, and we found acute melatonin treatment but not liothyronine (T3) supplementation improved the TBI-susceptible phenotypes of oxidative stress, excitotoxic neuronal loss and promotes functional recovery in the aged individuals with thyroid dysfunction. Our study suggests that monitoring thyroid function and acute administration of melatonin could be feasible therapeutics in the management of geriatric-TBI in clinic.

Keywords: aging; melatonin; oxidative stress; thyroid dysfunction; traumatic brain injury.


Conflict of interest statement

The authors declare no conflict of interest.

Figures

Figure 1
Figure 1
Increase in TBI-susceptible phenotypes in the middle-aged animals. (A) Schematic illustration of experimental designs; (B) Behavioral performance of motor function, including corner test and neurological severity scores at different time points after CCI challenge; (C) Behavioral performance of cognitive function in an object location recognition task and spontaneous alternation Y maze. Data are presented as mean ± SEM. n = 8 to 10 mice; (D,E) Quantification and representative images of FJC-positive degenerating neurons. n = 15 images from 5 mice; (FH) Quantification of the relative expression levels of Bcl2, Bax and Bak1 mRNAs from different experimental groups. n = 5 mice; (I,J) Quantification and representative images of Nissl stains showing the surviving neurons. n = 15 images from 5 mice. Data are presented as mean ± SEM in (EJ) and analyzed by a one-way ANOVA with Bonferroni’s post hoc analysis. * p < 0.05. Scale = 25μm.
Figure 2
Figure 2
Increase in microgliosis and astrogliosis after CCI in the middle-aged animals. (A) Representative images of IBA1-positive microglial cells (color in magenta) and GFAP-positive astroglial cells (color in yellow) from different experimental groups. Blue, DAPI signal for the nuclear stain. Scale = 25μm; (B,C) Quantification of the regional density and percentage of area covered by IBA1 positive cells; (D,E) Quantification of the regional density and percentage of area covered by GFAP positive cells. n = 15 images from 5 mice in (BE); (FI) Quantification of the relative expression levels of Tnf, Il6, Il1b and Cxcl1 mRNAs from different experimental groups. n = 5 mice. All the data are presented as mean ± SEM and analyzed by a one-way ANOVA with Bonferroni’s post hoc analysis. * p < 0.05.
Figure 3
Figure 3
Correlation of thyroid function to the TBI-susceptible phenotypes. (A) Representative images showing the anatomical outlines of bilateral thyroid lobes from adult and middle-aged animals; (BD) Quantification of the thyroid weight, serum free T4 and free T3 levels. n = 8 to 10 mice. Data are presented as mean ± SEM and are analyzed by a two-tailed unpaired t-test. (E) Pearson’s correlation plots between individual serum T4 with their behavioral or inflammatory indexes after CCI; (F) Pearson’s correlation plots between individual serum T3 with their behavioral or inflammatory indexes after CCI; (G) Pearson’s correlation plots between individual thyroid weight with their behavioral or inflammatory indexes after CCI. n = 20 mice.
Figure 4
Figure 4
Increase in TBI-susceptible phenotypes after surgical thyroidectomy. (A) Schematic illustration of the experimental designs; (B) Representative images showing the surgical removal of bilateral thyroid lobes. (C,D) Quantification of the serum free T4 and free T3 levels. n = 8 to 10 mice. Data are presented as mean ± SEM and are analyzed by a two-tailed unpaired t-test. * p < 0.05. (E) Behavioral performance of motor function, including corner test and neurological severity scores at different time points after CCI challenge; (F) Behavioral performance of cognitive function in the object location recognition task and spontaneous alternation Y maze at different time points after CCI. n = 8 to 10 mice. Data are presented as mean ± SEM and are analyzed by a one-way repeated measures ANOVA with Bonferroni’s post hoc analysis. * p < 0.05.
Figure 5
Figure 5
Increase in TBI-induced neuronal loss after surgical thyroidectomy. (A,B) Quantification and representative images of FJC-positive degenerating neurons in the hippocampus. n = 15 images from 5 mice; (CE) Quantification of the relative expression levels of Bcl2, Bax and Bak1 mRNAs from different experimental groups. n = 5 mice. (F,G) Quantification and representative images of Nissl stains showing the surviving neurons in the hippocampus. n = 15 images from 5 mice. Data are presented as mean ± SEM (BG) and analyzed by a one-way ANOVA with Bonferroni’s post hoc analysis. * p < 0.05. Scale = 25 μm.
Figure 6
Figure 6
Increase in microgliosis and astrogliosis after CCI in the thyroidectomized animals. (A) Representative images of IBA1-positive microglial cells (color in magenta) and GFAP-positive astroglial cells (color in yellow) from different experimental groups. Blue, DAPI signal for the nuclear stain. Scale = 25μm; (B,C) Quantification of the regional density and percentage of area covered by IBA1-positive cells; (D,E) Quantification of the regional density and percentage of area covered by GFAP-positive cells. n = 15 images from 5 mice in (BE). (FI) Quantification of the relative expression levels of Tnf, Il6, Il1b and Cxcl1 mRNAs from different experimental groups with sham-operated or surgical removal of thyroid glands. n = 5 mice. All the data are presented as mean ± SEM and are analyzed by a one-way ANOVA with Bonferroni’s post hoc analysis. * p < 0.05.
Figure 7
Figure 7
Increase in oxidative stress after CCI in the thyroidectomized animals. (A) Representative images of 4-HNE-positive (color in red) neurons (NeuN, color in green) from different experimental groups; (B) Representative images of 8-oxodG-positive (color in magenta) neurons (NeuN, color in green). Blue, DAPI signal for the nuclear stain. Scale = 25μm; (C) Quantification of the percentage of neurons with 4-HNE-positive puncta; (D) Quantification of the regional density of the 8-oxodG-positive neurons. n = 15 images from 5 mice in (C) and (D); (E) Quantification of the levels of Malondialdehyde; (F) Quantification of the production of hydroxyl free radicals; (GJ) Quantification of the relative expression levels of Sod1, Sod2, Cat and Gpx1 mRNAs from different experimental groups with sham-operated or surgical removal of thyroid glands. n = 5 mice. All the data are presented as mean ± SEM and analyzed by a one-way ANOVA with Bonferroni’s post hoc analysis. * p < 0.05; ns, not significant.
Figure 8
Figure 8
Increase in oxidative stress after CCI in the middle-aged animals. (A,B) Representative images and quantification analyses of 4-HNE-positive (color in red) neurons (NeuN, color in green). Scale = 25μm. n = 15 images from 5 mice; (C) Quantification of the regional density of the 8-oxodG positive neurons in the hippocampus; (D) Quantification of the levels of malondialdehyde; (E) Quantification of the production of hydroxyl free radicals. n = 5 mice in (D,E); (F) Pearson’s correlation plots between individual serum T4 with MDA levels or production of hydroxyl free radicals after CCI; (G) Pearson’s correlation plots between individual serum T3 with MDA levels or production of hydroxyl free radicals after CCI; (H) Pearson’s correlation plots between individual thyroid weight with MDA levels or production of hydroxyl free radicals after CCI. n = 20 mice in (FH); (IL) Quantification of the relative expression levels of Sod1, Sod2, Cat and Gpx1 mRNAs. n = 5 mice. All the data are presented as mean ± SEM and are analyzed by a one-way ANOVA with Bonferroni’s post hoc analysis. * p < 0.05; ns, not significant.
Figure 9
Figure 9
Acute T3 supplementation has no therapeutic benefits in TBI-susceptible phenotypes. (A) Schematic illustration of the experimental designs with acute T3 supplementation; (B) Representative images of 4-HNE-positive (color in red) neurons (NeuN, color in green); (C) Representative images of 8-oxodG-positive (color in magenta) neurons (NeuN, color in green). Blue, DAPI signal for the nuclear stain. Scale = 25μm; (D) Quantification of the percentage of neurons with 4-HNE-positive puncta; (E) Quantification of the regional density of the 8-oxodG-positive neurons. n = 15 images from 5 mice in (D,E); (F) Quantification of the levels of malondialdehyde; (G) Quantification of the production of hydroxyl free radicals; (HI) Representative images of the Nissl stains and quantification analyses showing the surviving neurons in the hippocampal CA1 region. n = 15 images from 5 mice; (J) Behavioral performance of neurological severity scores. Behavioral performance of cognitive function in the object location recognition task (K) and spontaneous alternation Y maze (L) from different experimental groups. n = 8 to 10 mice. All the data are presented as mean ± SEM and are analyzed by a one-way ANOVA with Bonferroni’s post hoc analysis. * p < 0.05; ns, not significant.
Figure 10
Figure 10
Amelioration of TBI-susceptible phenotypes by acute melatonin treatment. (A) Schematic illustration of the experimental designs with acute melatonin treatment; (B) Representative images of 4-HNE-positive (color in red) neurons (NeuN, color in green); (C) Representative images of 8-oxodG-positive (color in magenta) neurons (NeuN, color in green). Blue, DAPI signal for the nuclear stain. Scale = 25 μm; (D) Quantification of the percentage of neurons with 4-HNE-positive puncta. (E) Quantification of the regional density of the 8-oxodG-positive neurons. n = 15 images from 5 mice in (D,E); (F) Quantification of the levels of malondialdehyde; (G) Quantification of the production of hydroxyl free radicals; (HI) Representative images of the Nissl stains and quantification analyses showing the surviving neurons in the hippocampal CA1 region. n = 15 images from 5 mice; (JL) Quantification of the relative expression levels of Sod1, Cat and Gpx1 mRNAs from different experimental groups with or without melatonin treatment. n = 5 mice. Behavioral performance of motor function including the corner test (M) and neurological severity scores (N). Behavioral performance of cognitive function in the object location recognition task (O) and spontaneous alternation Y maze (P). n = 8 to 10 mice. All the data are presented as mean ± SEM and analyzed by a one-way ANOVA with Bonferroni’s post hoc analysis. * p < 0.05; ns, not significant.
Figure 11
Figure 11
Working model of the major findings in our current study. Numerous pathological events initiated at the acute stage after brain trauma, which contribute to the profound behavioral deficits. Then, the induction of endogenous thyroid hormone-dependent compensatory regulation of anti-oxidant events ameliorates the oxidative stress and inflammatory events that lead to a gradual functional recovery of behavioral performance. Loss of such protective events after surgical removal of the thyroid gland or in aged-associated thyroid dysfunction suppressed the functional recovery of the brain that resulted in TBI-susceptible phenotypes. Events labeled in green color (such as the melatonin treatment) indicate the protective impact on TBI-severity and events labeled in red color (such as aging or thyroidectomy) indicate the adverse impact on TBI-severity.

References

    1. Lo J., Chan L., Flynn S. A Systematic Review of the Incidence, Prevalence, Costs, and Activity and Work Limitations of Amputation, Osteoarthritis, Rheumatoid Arthritis, Back Pain, Multiple Sclerosis, Spinal Cord Injury, Stroke, and Traumatic Brain Injury in the United States: A 2019 Update. Arch. Phys. Med. Rehabil. 2021;102:115–131. doi: 10.1016/j.apmr.2020.04.001. - DOI - PMC - PubMed
    1. Schneider A.L.C., Wang D., Ling G., Gottesman R.F., Selvin E. Prevalence of Self-Reported Head Injury in the United States. N. Engl. J. Med. 2018;379:1176–1178. doi: 10.1056/NEJMc1808550. - DOI - PMC - PubMed
    1. Whiteneck G.G., Cuthbert J.P., Corrigan J.D., Bogner J.A. Prevalence of Self-Reported Lifetime History of Traumatic Brain Injury and Associated Disability: A Statewide Population-Based Survey. J. Head Trauma Rehabil. 2016;31:E55–E62. doi: 10.1097/HTR.0000000000000140. - DOI - PubMed
    1. Gardner R.C., Dams-O’Connor K., Morrissey M.R., Manley G.T. Geriatric Traumatic Brain Injury: Epidemiology, Outcomes, Knowledge Gaps, and Future Directions. J. Neurotrauma. 2018;35:889–906. doi: 10.1089/neu.2017.5371. - DOI - PMC - PubMed
    1. Thompson H.J., McCormick W.C., Kagan S.H. Traumatic brain injury in older adults: Epidemiology, outcomes, and future implications. J. Am. Geriatr. Soc. 2006;54:1590–1595. doi: 10.1111/j.1532-5415.2006.00894.x. - DOI - PMC - PubMed

LinkOut - more resources