. 2023 Jan 21;12(2):241.
doi: 10.3390/antiox12020241.

Transcriptomic Profiling and Pathway Analysis of Mesenchymal Stem Cells Following Low Dose-Rate Radiation Exposure

Affiliations

Transcriptomic Profiling and Pathway Analysis of Mesenchymal Stem Cells Following Low Dose-Rate Radiation Exposure

John E Slaven et al. Antioxidants (Basel). .

Abstract

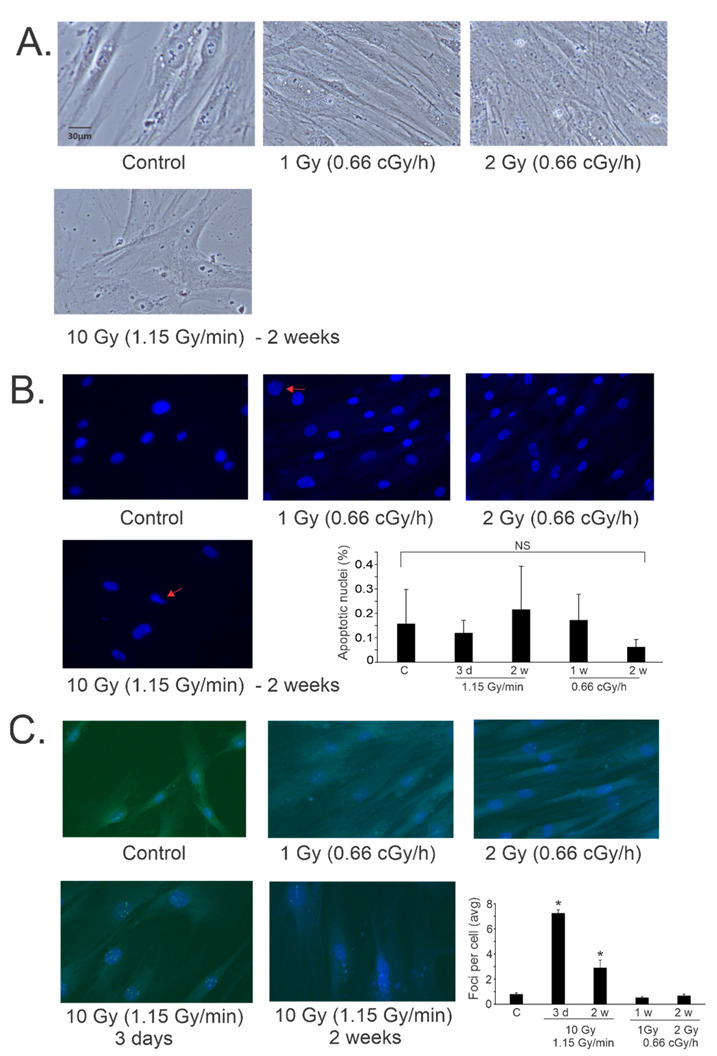
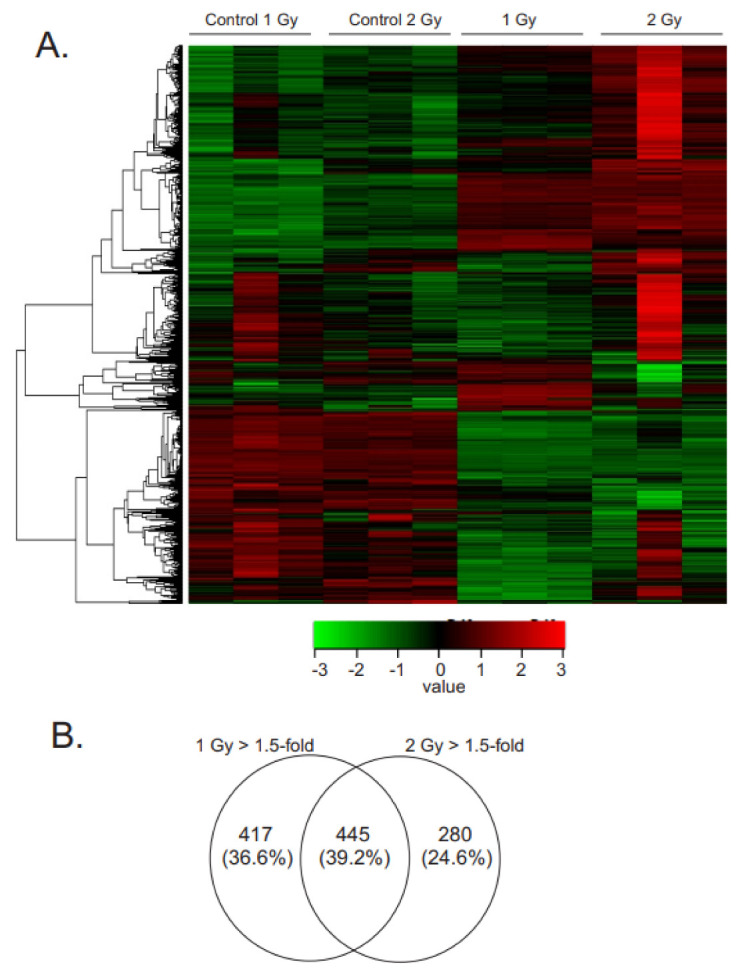
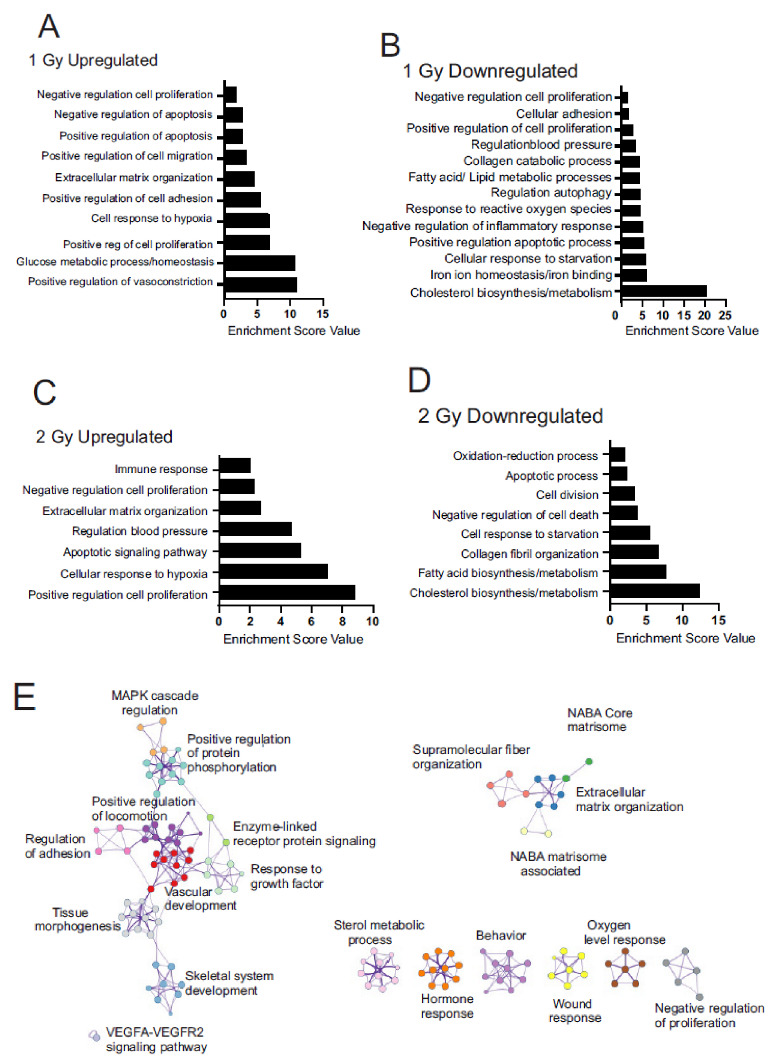
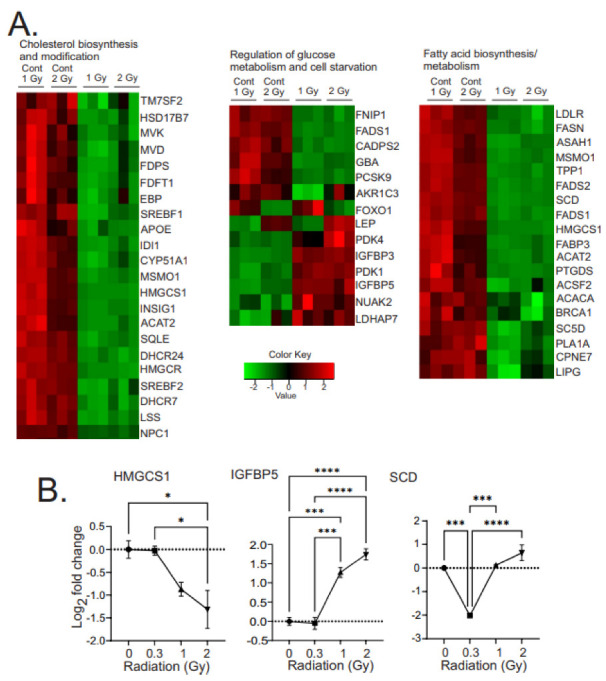
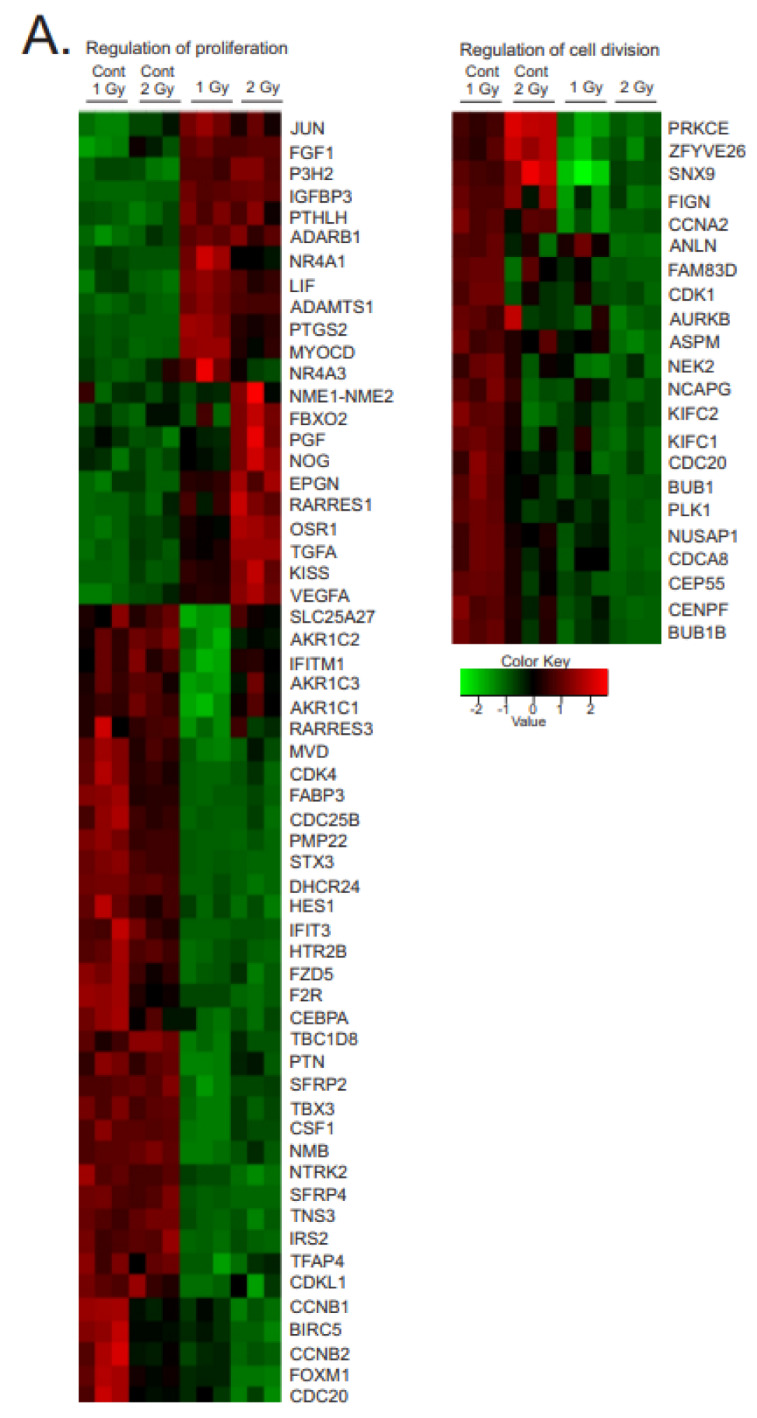
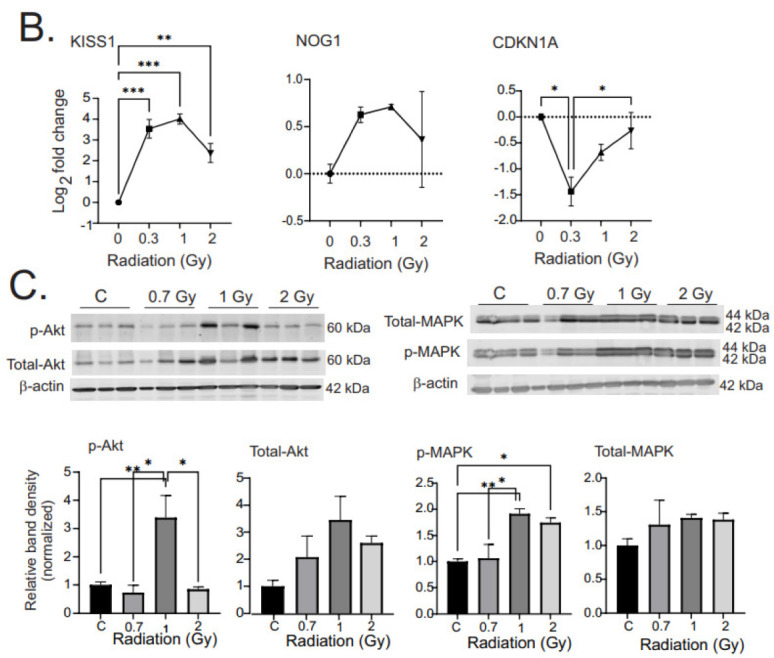
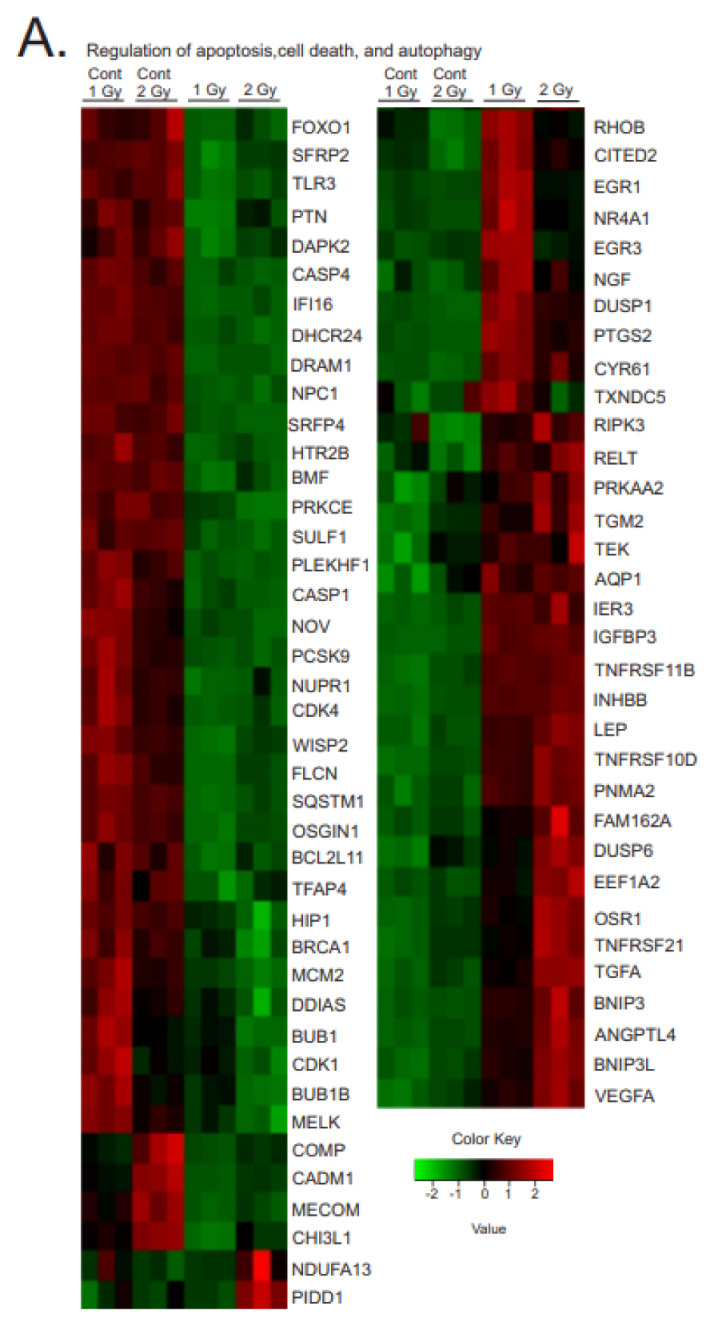
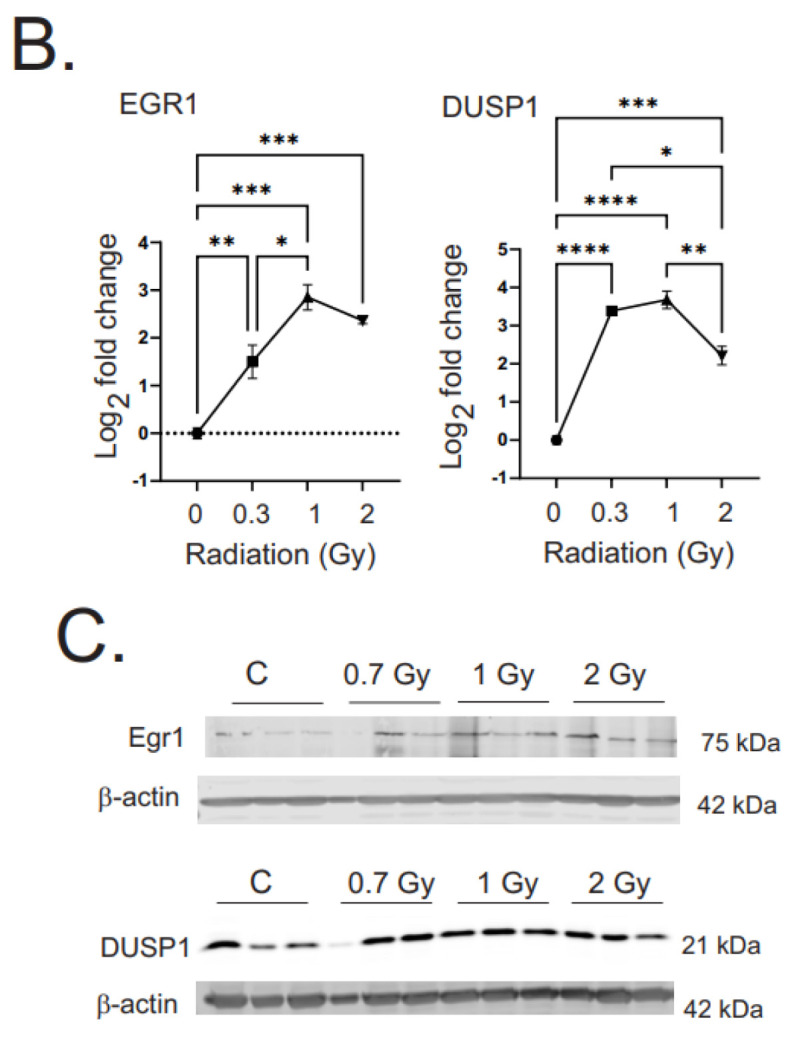
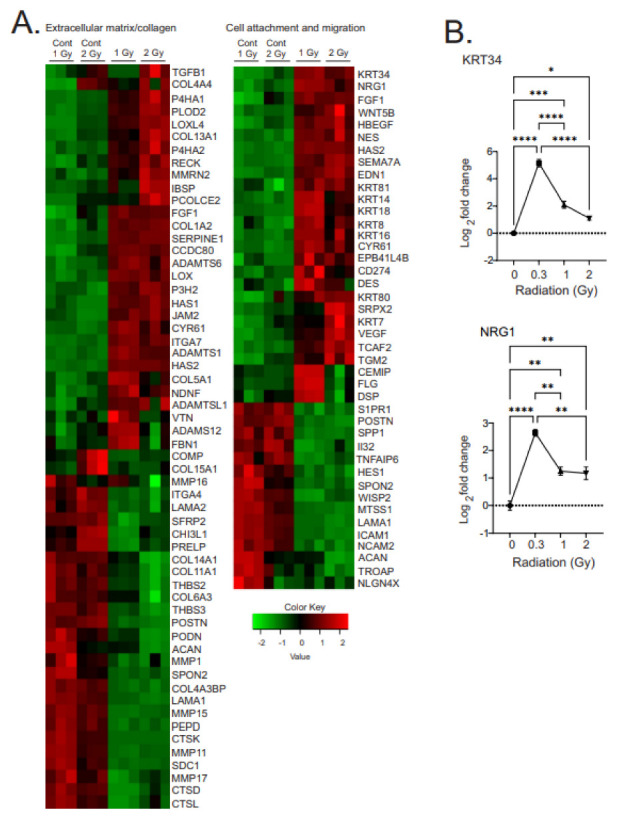
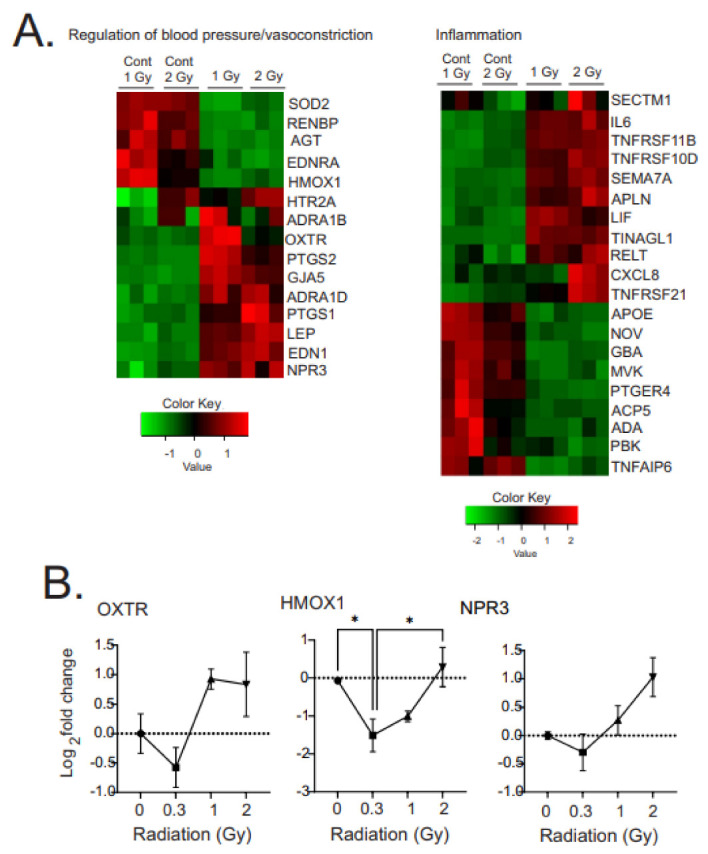
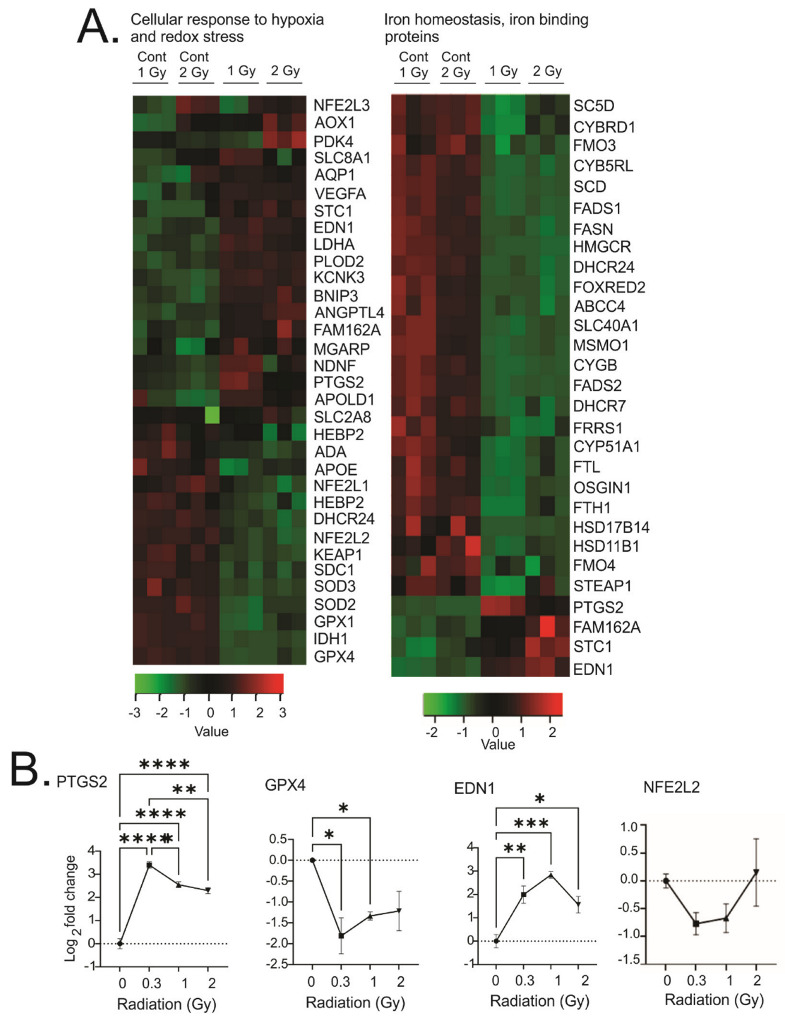
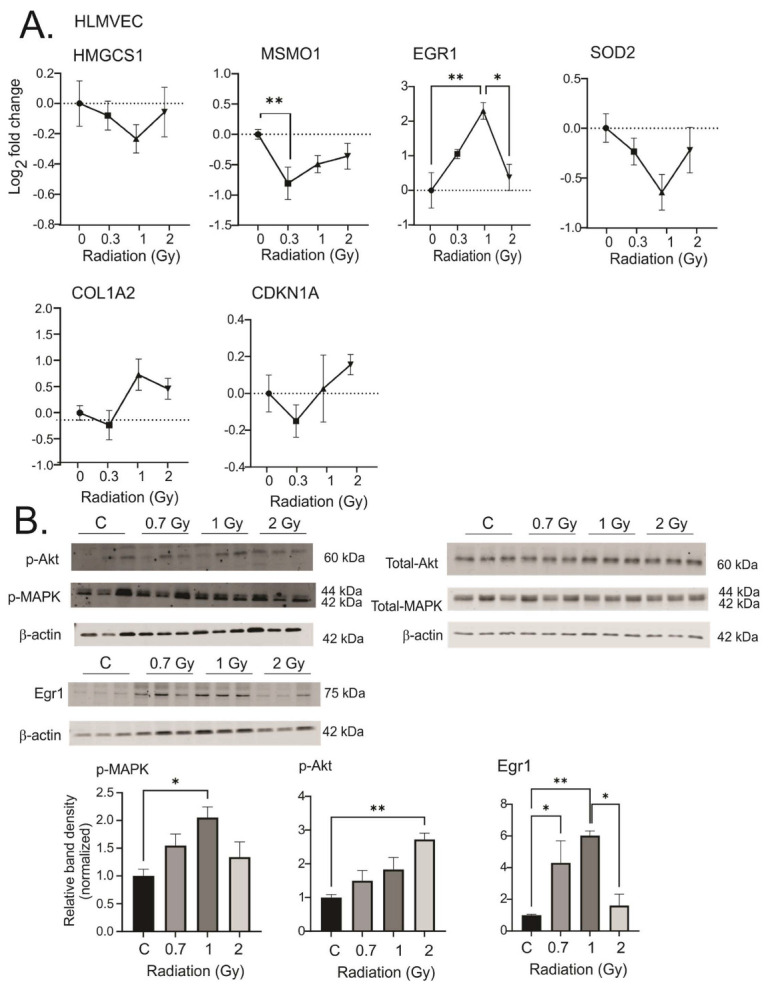
Low dose-rate radiation exposure can occur in medical imaging, as background from environmental or industrial radiation, and is a hazard of space travel. In contrast with high dose-rate radiation exposure that can induce acute life-threatening syndromes, chronic low-dose radiation is associated with Chronic Radiation Syndrome (CRS), which can alter environmental sensitivity. Secondary effects of chronic low dose-rate radiation exposure include circulatory, digestive, cardiovascular, and neurological diseases, as well as cancer. Here, we investigated 1-2 Gy, 0.66 cGy/h, 60Co radiation effects on primary human mesenchymal stem cells (hMSC). There was no significant induction of apoptosis or DNA damage, and cells continued to proliferate. Gene ontology (GO) analysis of transcriptome changes revealed alterations in pathways related to cellular metabolism (cholesterol, fatty acid, and glucose metabolism), extracellular matrix modification and cell adhesion/migration, and regulation of vasoconstriction and inflammation. Interestingly, there was increased hypoxia signaling and increased activation of pathways regulated by iron deficiency, but Nrf2 and related genes were reduced. The data were validated in hMSC and human lung microvascular endothelial cells using targeted qPCR and Western blotting. Notably absent in the GO analysis were alteration pathways for DNA damage response, cell cycle inhibition, senescence, and pro-inflammatory response that we previously observed for high dose-rate radiation exposure. Our findings suggest that cellular gene transcription response to low dose-rate ionizing radiation is fundamentally different compared to high-dose-rate exposure. We hypothesize that cellular response to hypoxia and iron deficiency are driving processes, upstream of the other pathway regulation.

Keywords: RNAseq; gene regulation; human microvascular endothelial cells; low dose-rate; mesenchymal stem cells; radiation.


Conflict of interest statement

The authors declare no conflict of interest.

Figures

Figure 1
Figure 1
Effects of high and low dose-rate X-ray irradiation on cell morphology, apoptosis, and γ-H2AX foci in MSCs. MSCs were grown to 60% confluence and exposed to 60Co irradiation at 0.66 cGy/h for 1 Gy (1 week) or 2 Gy (2 weeks). Alternatively, cells were exposed to 10 Gy X-ray irradiation (1.15 Gy/min) and assayed at 3 days and 1 week post-irradiation. Cells were fixed at the indicated times and stained with DAPI, and immunohistochemistry was performed for γ-H2AX. (A). Light microscopy was used to examine cell morphology. Representative images are shown, 20× magnification. (B). DAPI was used to examine the nucluear morphology of the fixed cells at the indicated times. Arrows (10 Gy irradiation) indicate nuclear blebbing, a late apoptotic event. Representative images are shown from each condition, 20× magnification. Nuclei were scored from all cells in random fields to determine percentage of apoptotic nuclei at 3 days (3 d), 1 week (1 w) or 2 weeks (2 w) post-irradiation. Graph shows average of percent apoptosis ± SEM; NS = not significant compared with control (C). (C). γ-H2AX immunohistochemistry was used to detect foci surrounding double-stranded DNA breaks in the fixed cells at the indicated times. Representative images are shown from each condition, 20× magnification. Foci were scored in all cells from random fields to determine numbers of foci per cell. Graph shows average of nuclear foci ± SEM; * indicates p < 0.05 compared with sham-irradiated control cells.
Figure 2
Figure 2
Gene expression changes in irradiated MSCs. MSCs were grown to 60% confluence and exposed to 60Co irradiation at 0.66 cGy/h for 1 Gy (1 week) or 2 Gy (2 weeks). Control cells were cultured under identical conditions for each time point. RNAseq was performed using N = 3 samples for each condition. (A). Heat map indicates gene expression patterns following radiation exposure. (B). Venn diagram illustrating the number of genes with altered expression at each time point, q < 0.05, absolute fold change >1.5.
Figure 3
Figure 3
GO term cluster, KEGG pathway enrichment, and Metascape analyses of differentially expressed genes in MSCs following chronic low dose-rate irradiation. MSCs were grown to 60% confluence and exposed to 60Co irradiation at 0.66 cGy/h for 1 Gy (1 week) or 2 Gy (2 weeks). Control cells were cultured under identical conditions for 1 or 2 weeks. Irradiated and control cells were lysed at the same time, and RNA was prepared for RNAseq. Pathway regulation was compared for all conditions. A,B. 1 Gy irradiation, upregulated pathways (A) and downregulated pathways (B). C,D. 2 Gy irradiation, upregulated pathways (C) and downregulated pathways (D). (E). Clustered GO terms using Metascape using genes with q < 0.05 to visualize pathway relationships.
Figure 4
Figure 4
Heatmaps of gene expression changes in pathways for cholesterol biosynthesis and modification, glucose metabolism and cell starvation, and fatty acid biosynthesis and metabolism. (A). RNAseq was used to identify gene expression changes in primary human MSCs following 1 or 2 Gy (0.66 cGy/h) 60Co irradiation. Control cells were cultured under identical conditions for 1 or 2 weeks. GO analysis was performed using DAVID and heatmaps were generated using genes with q < 0.05. Rows are centered and unit variance is applied to rows. (B). qPCR gene regulation using log base 2 scale fold change of genes supporting heatmaps of pathways. Data show averages ± SEM N = 3 biological replicates with two technical repeats; * indicates p < 0.05, *** indicates p < 0.001, **** indicates p < 0.0001, respectively, compared with sham irradiated control cells.
Figure 5
Figure 5
Heatmaps of gene expression changes for pathways in regulation of proliferation and cell division. (A). RNAseq was used to identify gene expression changes in primary human MSCs following 1 or 2 Gy (0.66 cGy/h) 60Co irradiation. Control cells were cultured under identical conditions for 1 or 2 weeks. GO analysis was performed using DAVID and heatmaps were generated using genes with q < 0.05. Rows are centered and unit variance is applied to rows. (B). qPCR gene regulation using log base 2 scale fold change of genes supporting heatmaps of pathways. Data show averages ± SEM N = 3 biological replicates with two technical repeats; * indicates p < 0.05, ** indicates p < 0.01, *** indicates p < 0.001, respectively, compared with sham-irradiated control cells. (C). Western blot data showing regulation of AKT and MAPK (phosphorylated and total). Western blots were performed on N = 3 biological repeats. Bar graphs show average band densities normalized to β-actin. Graphs show means ± SEM; * indicates p < 0.05 and ** indicates p < 0.01, respectively, compared with sham-irradiated control cells.
Figure 5
Figure 5
Heatmaps of gene expression changes for pathways in regulation of proliferation and cell division. (A). RNAseq was used to identify gene expression changes in primary human MSCs following 1 or 2 Gy (0.66 cGy/h) 60Co irradiation. Control cells were cultured under identical conditions for 1 or 2 weeks. GO analysis was performed using DAVID and heatmaps were generated using genes with q < 0.05. Rows are centered and unit variance is applied to rows. (B). qPCR gene regulation using log base 2 scale fold change of genes supporting heatmaps of pathways. Data show averages ± SEM N = 3 biological replicates with two technical repeats; * indicates p < 0.05, ** indicates p < 0.01, *** indicates p < 0.001, respectively, compared with sham-irradiated control cells. (C). Western blot data showing regulation of AKT and MAPK (phosphorylated and total). Western blots were performed on N = 3 biological repeats. Bar graphs show average band densities normalized to β-actin. Graphs show means ± SEM; * indicates p < 0.05 and ** indicates p < 0.01, respectively, compared with sham-irradiated control cells.
Figure 6
Figure 6
Heatmaps of gene expression changes for pathways in regulation of apoptosis, cell death, and autophagy. (A). RNAseq was used to identify gene expression changes in primary human MSCs following 1 or 2 Gy (0.66 cGy/h) 60Co irradiation. Control cells were cultured under identical conditions for 1 or 2 weeks. GO analysis was performed using DAVID and heatmaps were generated using genes with q < 0.05. Rows are centered and unit variance is applied to rows. (B). qPCR gene regulation using log base 2 scale fold change of genes supporting heatmaps of pathways. Data show averages ± SEM from N = 3 biological replicates with two technical repeats. * indicates p < 0.05, ** indicates p < 0.01, *** indicates p < 0.001, **** indicates p < 0.0001, respectively, compared with sham-irradiated control cells. (C). Western blot data showing regulation of Egr1 and DUSP1. Western blots were performed on N = 3 biological repeats. Bar graphs show average band densities normalized to β-actin.
Figure 6
Figure 6
Heatmaps of gene expression changes for pathways in regulation of apoptosis, cell death, and autophagy. (A). RNAseq was used to identify gene expression changes in primary human MSCs following 1 or 2 Gy (0.66 cGy/h) 60Co irradiation. Control cells were cultured under identical conditions for 1 or 2 weeks. GO analysis was performed using DAVID and heatmaps were generated using genes with q < 0.05. Rows are centered and unit variance is applied to rows. (B). qPCR gene regulation using log base 2 scale fold change of genes supporting heatmaps of pathways. Data show averages ± SEM from N = 3 biological replicates with two technical repeats. * indicates p < 0.05, ** indicates p < 0.01, *** indicates p < 0.001, **** indicates p < 0.0001, respectively, compared with sham-irradiated control cells. (C). Western blot data showing regulation of Egr1 and DUSP1. Western blots were performed on N = 3 biological repeats. Bar graphs show average band densities normalized to β-actin.
Figure 7
Figure 7
Heatmaps of gene expression changes for pathways involved in the regulation of extracellular matrix and collagen synthesis and cell attachment and migration. (A). RNAseq was used to identify gene expression changes in primary human MSCs following 1 or 2 Gy (0.66 cGy/h) 60Co irradiation. Control cells were cultured under identical conditions for 1 or 2 weeks. GO analysis was performed using DAVID and heatmaps were generated using genes with q < 0.05. Rows are centered and unit variance is applied to rows. (B). qPCR gene regulation using log base 2 scale fold change of genes supporting heatmaps of pathways. Data show averages ± SEM from N = 3 biological replicates with two technical repeats. * indicates p < 0.05, ** indicates p < 0.01, *** indicates p < 0.001, **** indicates p < 0.0001, respectively, compared with sham-irradiated control cells.
Figure 8
Figure 8
Heatmaps of gene expression changes for pathways involved in the regulation of blood pressure or vasoconstriction and inflammation. (A). RNAseq was used to identify gene expression changes in primary human MSCs following 1 or 2 Gy (0.66 cGy/h) 60Co irradiation. Control cells were cultured under identical conditions for 1 or 2 weeks. GO analysis was performed using DAVID and heatmaps were generated using genes with q < 0.05. Rows are centered and unit variance is applied to rows. (B). qPCR gene regulation using log base 2 scale fold change of genes supporting heatmaps of pathways. Data show averages ± SEM from N = 3 biological replicates with two technical repeats. * indicates p < 0.05 compared with sham-irradiated control cells.
Figure 9
Figure 9
Heatmaps of gene expression changes for pathways involved in cellular response to hypoxia or redox stress and iron homeostasis and iron-binding proteins. (A). RNAseq was used to identify gene expression changes in primary human MSCs following 1 or 2 Gy (0.66 cGy/h) 60Co irradiation. Control cells were cultured under identical conditions for 1 or 2 weeks. GO analysis was performed using DAVID and heatmaps were generated using genes with q < 0.05. Rows are centered and unit variance is applied to rows. (B). qPCR gene regulation using log base 2 scale fold change of genes supporting heatmaps of pathways. Data show averages ± SEM from N = 3 biological replicates with two technical repeats. * indicates p < 0.05, ** indicates p < 0.01, *** indicates p < 0.001, **** indicates p < 0.0001, respectively, compared with sham-irradiated control cells.
Figure 10
Figure 10
Response of human lung microvascular endothelial cells (HLMVECs) to chronic low dose-rate irradiation. HLMVECs were grown to 50% confluence and exposed to 60Co irradiation at 0.64 cGy/h for 1 Gy (1 week) or 2 Gy (2 weeks). Control cells were cultured under identical conditions. Irradiated and control cells were lysed at the same time, and either frozen for protein analysis or placed in RNAlater. (A). qPCR gene regulations are represented on a log base 2 fold change scale, using N = 3 biological replicates with two technical repeats. Graphs show means ± SEM; * indicates p < 0.05 and ** indicates p < 0.01, respectively, compared with sham-irradiated control cells. (B). Western blots of phosphorylated and total MAPK and Akt, and Egr1. Western blots were performed on N = 3 biological repeats. Bar graphs show average band densities normalized to β-actin. Graphs show means ± SEM; * indicates p < 0.05 and ** indicates p < 0.01, respectively, compared with sham-irradiated control cells.

References

    1. Zuo J., Zhang Z., Luo L., Nice E., Zhang W., Wang C., Huang C. Redox signaling at the crossroads of human health and disease. MedComm. 2022;3:e127. doi: 10.1002/mco2.127. - DOI - PMC - PubMed
    1. Tretter V., Hochreiter B., Zach M., Krenn K., Klein K. Understanding cellular redox homeostasis: A challenge for precision medicine. Int. J. Mol. Sci. 2021;23:106. doi: 10.3390/ijms23010106. - DOI - PMC - PubMed
    1. Sies H., Jones D.P. Reactive oxygen species (ROS) as pleiotropic physiological signalling agents. Nat. Rev. Mol. Cell Biol. 2020;21:363–383. doi: 10.1038/s41580-020-0230-3. - DOI - PubMed
    1. Lennicke C., Cocheme H. Redox metabolism: ROS as specific molecular regulators of cell signaling and function. Mol. Cell. 2021;81:3691–3707. doi: 10.1016/j.molcel.2021.08.018. - DOI - PubMed
    1. Panganiban R.A., Snow A., Day R. Mechanisms of radiation toxicity in transformed and non-transformed cells. Int. J. Mol. Sci. 2013;14:15931–15958. doi: 10.3390/ijms140815931. - DOI - PMC - PubMed

LinkOut - more resources