. 2023 Feb 1;12(2):346.
doi: 10.3390/antiox12020346.

Solanum dulcamara L. Berries: A Convenient Model System to Study Redox Processes in Relation to Fruit Ripening

Affiliations

Solanum dulcamara L. Berries: A Convenient Model System to Study Redox Processes in Relation to Fruit Ripening

Milica Milutinović et al. Antioxidants (Basel). .

Abstract

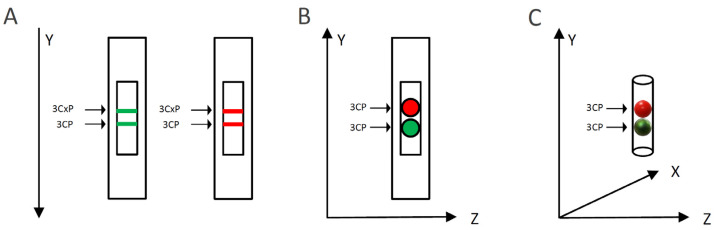
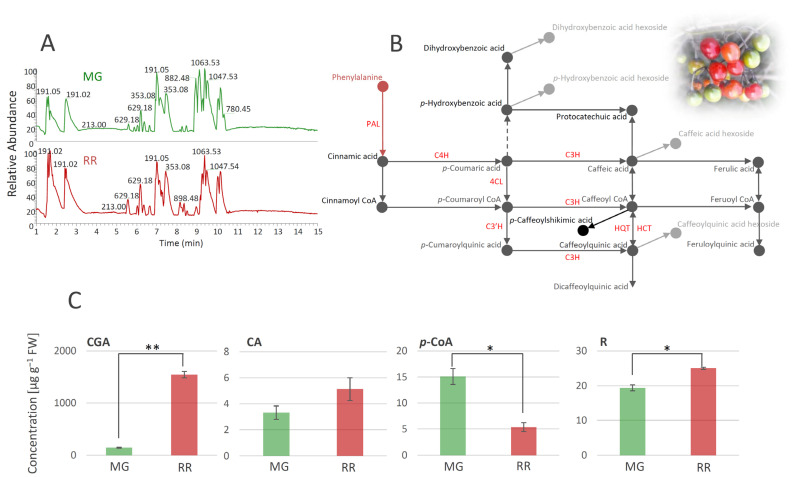
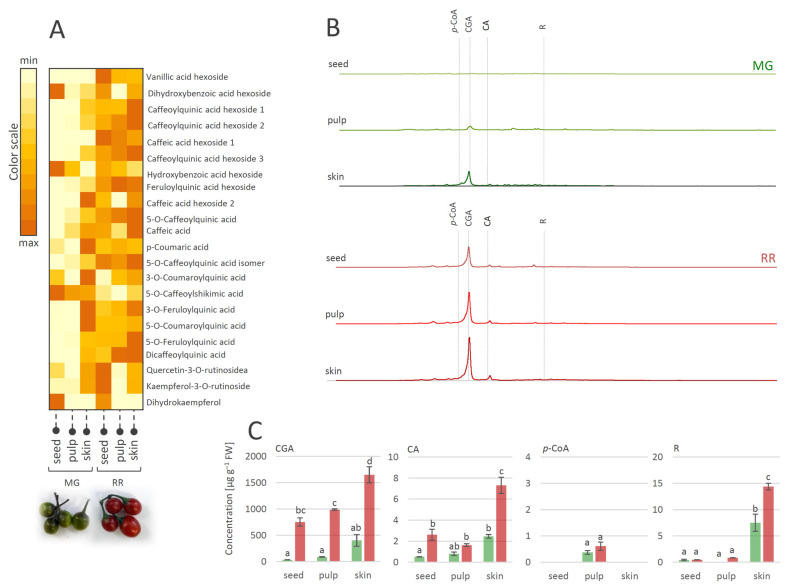
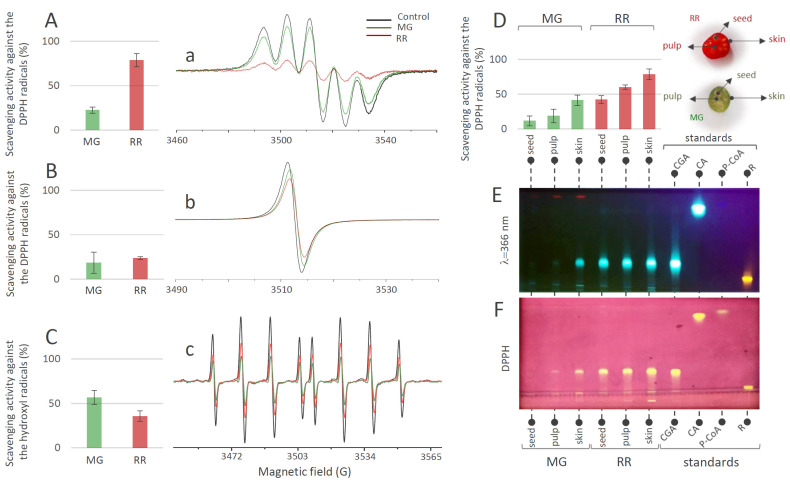
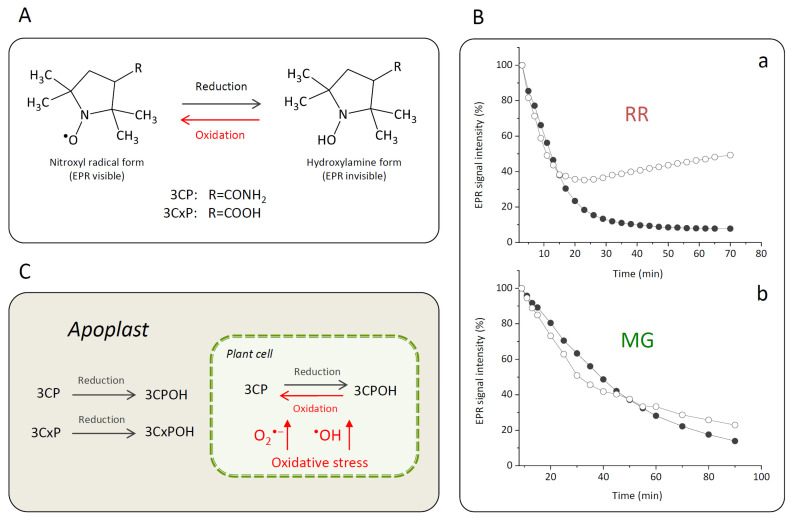
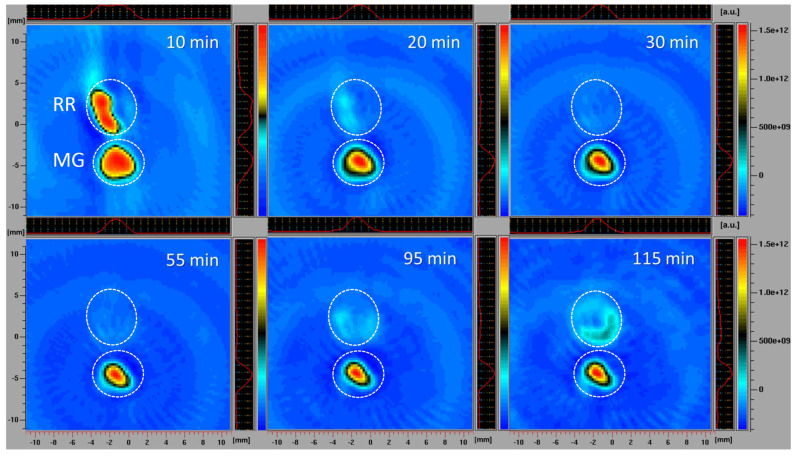
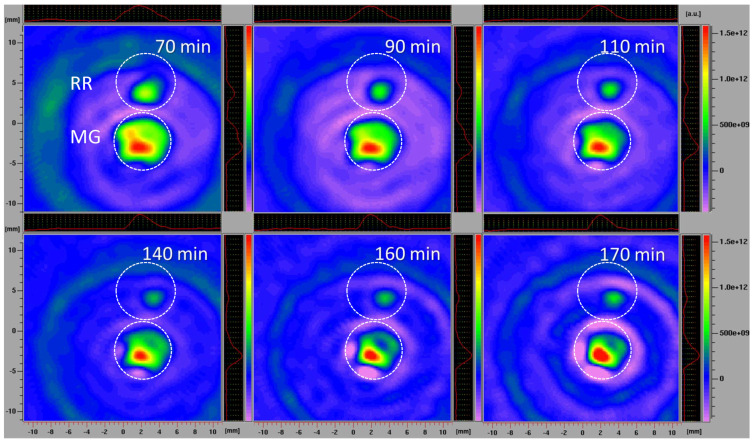
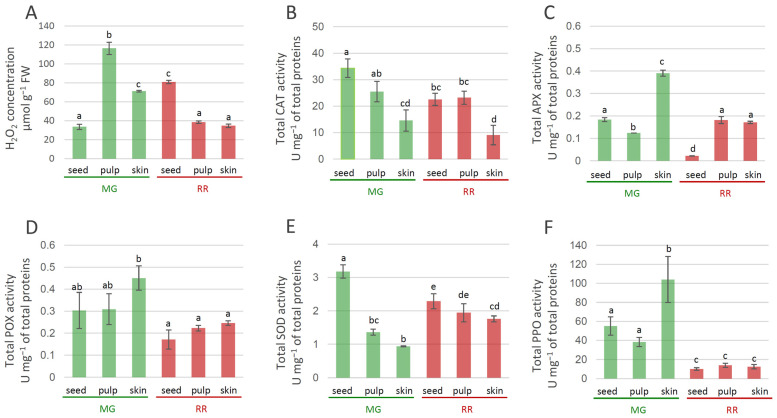
The present study provides, for the first time, a physicochemical and biochemical characterization of the redox processes associated with the ripening of Solanum dulcamara L. (bittersweet) berries. Electron Paramagnetic Resonance Spectroscopy (EPRS) and Imaging (EPRI) measurements of reactive oxygen species (ROS) were performed in parallel with the tissue-specific metabolic profiling of major antioxidants and assessment of antioxidant enzymes activity. Fruit transition from the mature green (MG) to ripe red (RR) stage involved changes in the qualitative and quantitative content of antioxidants and the associated cellular oxidation and peroxidation processes. The skin of bittersweet berries, which was the major source of antioxidants, exhibited the highest antioxidant potential against DPPH radicals and nitroxyl spin probe 3CP. The efficient enzymatic antioxidant system played a critical protective role against the deleterious effects of progressive oxidative stress during ripening. Here, we present the EPRI methodology to assess the redox status of fruits and to discriminate between the redox states of different tissues. Interestingly, the intracellular reoxidation of cell-permeable nitroxide probe 3CP was observed for the first time in fruits or any other plant tissue, and its intensity is herein proposed as a reliable indicator of oxidative stress during ripening. The described noninvasive EPRI technique has the potential to have broader application in the study of redox processes associated with the development, senescence, and postharvest storage of fruits, as well as other circumstances in which oxidative stress is implicated.

Keywords: EPR imaging; ROS; Solanum dulcamara; antioxidants; bittersweet; fruits; redox state.


Conflict of interest statement

The authors declare no conflict of interest.

Figures

Figure 1
Figure 1
Schematic representation of the EPRI experimental setup for: (A) X-band 1D gradient, (B) X-band 2D, and (C) L-band 2D imaging. Green and red colors represent mature green (MG) and ripe red (RR) bittersweet fruits, respectively.
Figure 2
Figure 2
UHPLC/LTQ Orbitrap MSn chromatograms of methanol extracts of mature green (MG) and ripe red (RR) bittersweet fruits (A). Based on the qualitative profiles of polyphenolics, a putative biosynthetic route of major phenolic acids in bittersweet fruits is proposed (B), which is mainly represented by chlorogenic acid (caffeoylquinic acid), caffeic acid, and p-coumaric acid. UHPLC/(−)HESI-MS2 quantitative analysis of major phenolic acids in MG and RR fruits (C): Asterisks (*) denote significant differences between MG and RR fruits according to the t-test, p values: * p ≤ 0.05; ** p ≤ 0.01. Abbreviations: PAL—phenylalanine ammonia-lyase; C4H—cinnamate hydroxylase; 4CL—4-hydroxycinnamoyl-CoA ligase; C3H—p-coumaroyl ester 3-hydroxilase; C3′H—p-coumaroylester 3′-hydroxylases; HQT—hydroxycinnamoyl CoA quinate transferase; HCT—hydroxycinnamoyl-CoA shikimate/quinate hydroxycinnamoil transferase; CGA—chlorogenic acid (caffeoylquinic acid); CA—caffeic acid; p-CoA—p-coumaric acid; R—rutin.
Figure 3
Figure 3
(A) Heat-map presenting relative amounts of polyphenolics in different tissues of mature green (MG) and ripe red (RR) bittersweet fruits, as analyzed by UHPLC/LTQ Orbitrap MSn. Color scale indicates values representing peak areas of compounds, distributed between min and max values among tissues, for each compound individually. (B) UHPLC/DAD chromatograms of MeOH extracts of seed, pulp, and skin of MG and RR fruits are presented, acquired at λ = 260 nm. (C) UHPLC/(−)HESI-MS2 quantitative analysis of major phenolic acids in MG and RR fruits. Letters above the bars denote significant differences according to Tukey’s pairwise test at p ≤ 0.05. Abbreviations: CGA—chlorogenic acid (caffeoylquinic acid); CA—caffeic acid; p-CoA—p-coumaric acid; R-rutin.
Figure 4
Figure 4
DPPH scavenging activity (%) obtained 2 min after the addition of DPPH into the bittersweet fruits system containing (A) MeOH extracts or (B) water extracts of MG (green bars) and RR (red bars), and representative EPR spectra of (a) DPPH radical in MeOH (black line), and in reaction with the MG (green line) and RR (red line) fruit MeOH extracts system, and (b) DPPH radical in H2O (black line), and in reaction with the MG (green line) and RR (red line) fruit water extracts system. (C) OH scavenging activity (%) obtained 2 min after the OH generation in the Fenton reaction system containing H2O extracts of MG (green) and RR (red) bittersweet fruits, and (c) representative EPR spectra of DEPMPO/OH spin adducts obtained in the Fenton reaction system without (black line) and in reaction with the MG (green line) and RR (red line) fruit water extracts. (D) DPPH scavenging activity (%) recorded 2 min after the addition of DPPH into the system containing MeOH extracts of the skin, pulp, and seeds of MG (green) and RR (red) bittersweet fruits. Values are the means of three biological replicates, and error bars represent signal-to-noise ratio. (E) HPTLC of MeOH extracts of seed, pulp, and skin of MG and RR bittersweet berries at 366 nm, and (F) corresponding HPTLCDPPH assay.
Figure 5
Figure 5
(A) Reversible one-electron reduction–oxidation showing the interconversion between the nitroxide 3CP and 3CxP spin probes (EPR visible) and corresponding reduced hydroxylamine forms 3CPOH and 3CxPOH (EPR invisible). (B) Kinetics of change of the EPR signal intensity of spin probes 3CP (white circles) and 3CxP (black circles) in strips of RR (a) and MG (b) bittersweet fruits adopting the X-band 1D gradient EPRI technique. (C) Proposed mechanism of the 3CP and 3CxP reduction–oxidation as influenced by the oxidative stress in bittersweet fruits and their localization in the cellular compartmentation.
Figure 6
Figure 6
X−band 2D EPR images of slices of MG and RR bittersweet fruits recorded 10, 20, 30, 55, 95, and 115 min after the administration of the spin probe. The upper signal relates to the ripe red (RR) and the lower to the mature green (MG) bittersweet fruits. The signal amplitude in arbitrary units is shown in the form of color scales, which represent the intensities/concentrations of the 3CP spin probe in samples, with the red color indicating the zones/tissues with the highest content of 3CP in the form of nitroxyl radical. The black/green colors indicate tissues with lower levels of 3CP in the form of nitroxyl radical. MG fruits were treated with 2 mM 3CP, and RR fruits with 15 mM 3CP.
Figure 7
Figure 7
L−band 2D EPR images of MG and RR bittersweet fruits recorded after 70, 90, 110, 140, 160, and 170 min. The upper signal relates to the RR and the lower to the MG fruits. The signal amplitude in arbitrary units is shown on color scales, which present the intensities/concentrations of the 3CP spin probe in samples, with red color indicating the zones/tissues with the highest content of 3CP in the form of nitroxyl radical. The light/dark green colors indicate tissues with lower levels of 3CP in the form of nitroxyl radical.
Figure 8
Figure 8
Tissue-specific concentration of H2O2 in MG (green bars) and RR (red bars) bittersweet fruits (A), as well as activities of antioxidant enzymes: CAT (B), APX (C), POX (D), SOD (E), PPO (F). Values are presented as means of three biological replicates and standard errors. Samples denoted by the same letter are not significantly different (p ≤ 0.05) according to Fisher’s LSD test. Abbreviations: CAT—catalase; APX—ascorbate peroxidase; POX—peroxidase; SOD—superoxide dismutase; PPO—polyphenoloxidase.

References

    1. Decros G., Baldet P., Beauvoit B., Stevens R., Flandin A., Colombié S., Gibon Y., Pétriacq P. Get the Balance Right: ROS Homeostasis and Redox Signalling in Fruit. Front. Plant Sci. 2019;10:1091. doi: 10.3389/fpls.2019.01091. - DOI - PMC - PubMed
    1. King County Noxious Weed Control Program. Garlic Mustard Best Management Practices. [(accessed on 24 November 2022)];2010 Available online: http://your.kingcounty.gov/dnrp/library/water-and-land/weeds/BMPs/Garlic....
    1. Ui I., Okajo A., Endo K., Utsumi H., Matsumoto K.-I. Effect of Hydrogen Peroxide in Redox Status Estimation Using Nitroxyl Spin Probe. Free. Radic. Biol. Med. 2004;37:2012–2017. doi: 10.1016/j.freeradbiomed.2004.09.012. - DOI - PubMed
    1. Dragišić Maksimović J., Mojović M., Vučinić Ž., Maksimović V. Spatial Distribution of Apoplastic Antioxidative Constituents in Maize Root. Physiol. Plant. 2021;173:818–828. doi: 10.1111/ppl.13476. - DOI - PubMed
    1. Kostić A.Ž., Gašić U.M., Pešić M.B., Stanojević S.P., Barać M.B., Mačukanović-Jocić M.P., Avramov S.N., Tešić Ž.L. Phytochemical Analysis and Total Antioxidant Capacity of Rhizome, Above-Ground Vegetative Parts and Flower of Three Iris Species. Chem. Biodivers. 2019;16:e1800565. doi: 10.1002/cbdv.201800565. - DOI - PubMed

LinkOut - more resources