. 2023 Feb 10;12(2):453.
doi: 10.3390/antiox12020453.

Mitochondrial-Targeted Antioxidant MitoQ-Mediated Autophagy: A Novel Strategy for Precise Radiation Protection

Affiliations

Mitochondrial-Targeted Antioxidant MitoQ-Mediated Autophagy: A Novel Strategy for Precise Radiation Protection

Xingting Bao et al. Antioxidants (Basel). .

Abstract

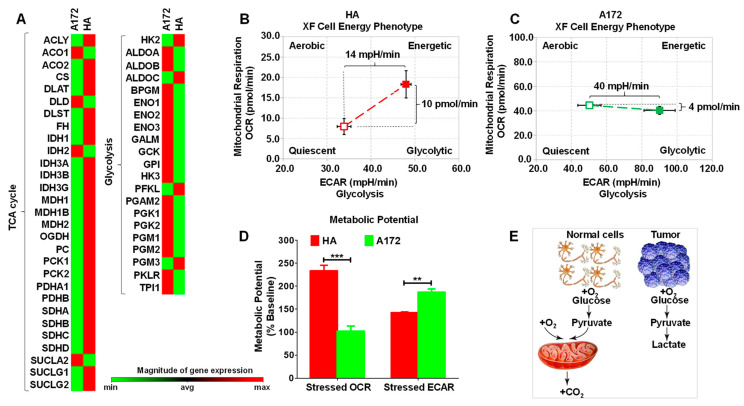
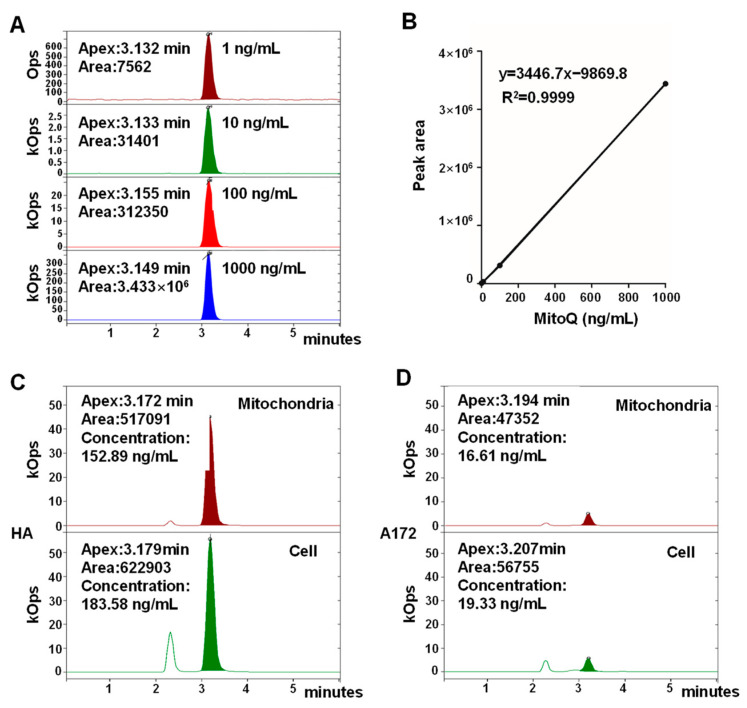
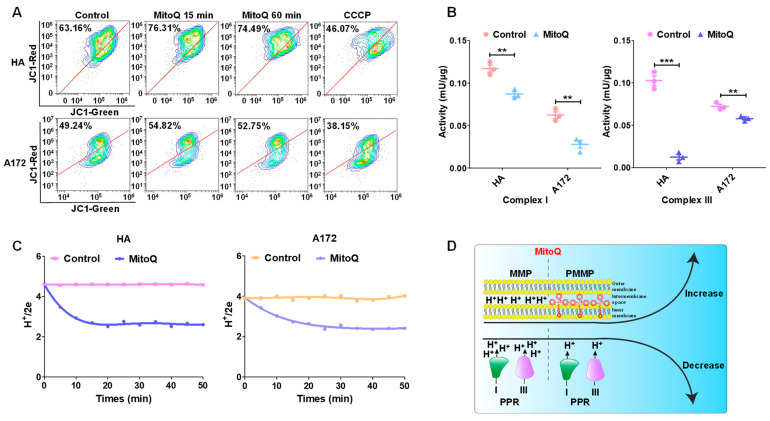
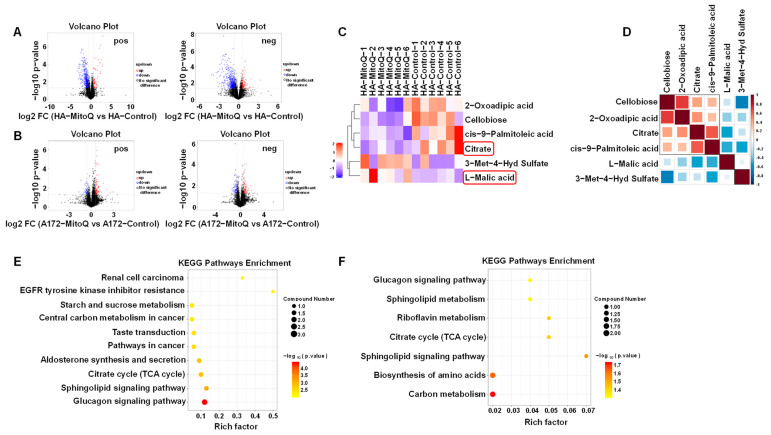
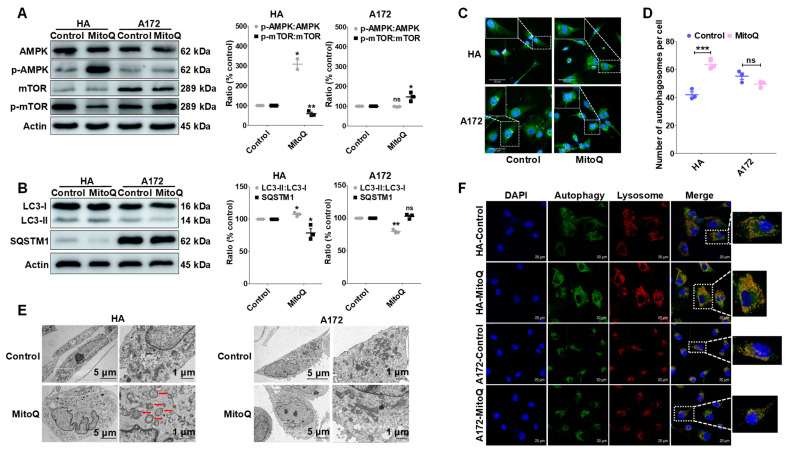
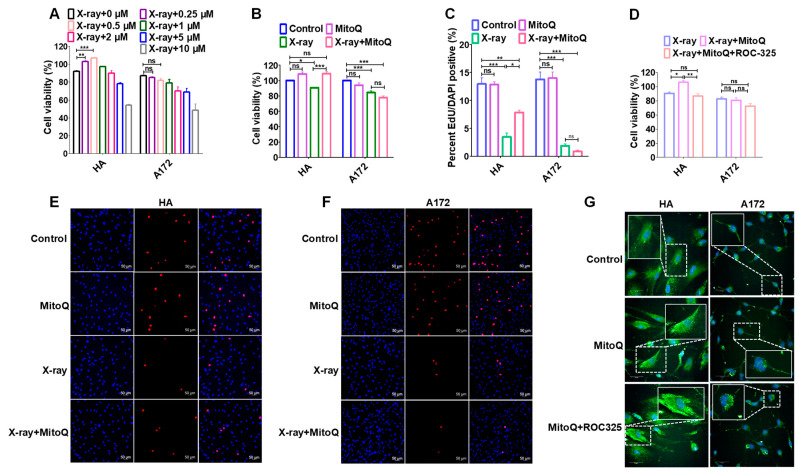
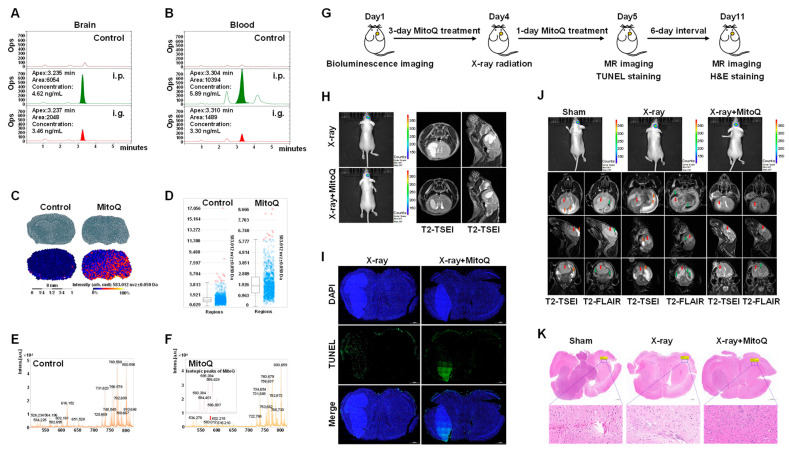
Radiotherapy (RT) is one of the most effective cancer treatments. However, successful radiation protection for normal tissue is a clinical challenge. Our previous study observed that MitoQ, a mitochondria-targeted antioxidant, was adsorbed to the inner mitochondrial membrane and remained the cationic moiety in the intermembrane space. The positive charges in MitoQ restrained the activity of respiratory chain complexes and decreased proton production. Therefore, a pseudo-mitochondrial membrane potential (PMMP) was developed via maintenance of exogenous positive charges. This study identified that PMMP constructed by MitoQ could effectively inhibit mitochondrial respiration within normal cells, disrupt energy metabolism, and activate adenosine 5'-monophosphate (AMP)-activated protein kinase (AMPK) signaling to induce autophagy. As such, it could not lead to starvation-induced autophagy among tumor cells due to the different energy phenotypes between normal and tumor cells (normal cells depend on mitochondrial respiration for energy supply, while tumor cells rely on aerobic glycolysis). Therefore, we successfully protected the normal cells from radiation-induced damage without affecting the tumor-killing efficacy of radiation by utilizing selective autophagy. MitoQ-constructed PMMP provides a new therapeutic strategy for specific radiation protection.

Keywords: MitoQ; PMMP; autophagy; energy phenotype; radioprotection.


Conflict of interest statement

The authors declare no conflict of interest.

Figures

Figure 1
Figure 1
Cell energy phenotype of HA and A172 cells. (A) Human Signal Transduction Pathway Finder PCR Array was used to evaluate the expression of 50 essential genes related to glycolysis and the TCA cycle. Red indicates high expression levels, whereas green indicates low expression levels (n = 3). The Agilent Seahorse XFp Cell Energy Phenotype Test Kit was used to assess that normal astrocyte HA tends to supply energy through mitochondrial respiration (B). In contrast, glioma cell A172 tends to provide energy through glycolysis (C). (D) The metabolic Potential of HA and A172 cells is the ability of the cell to meet energy demand through respiration or glycolysis. (E) Schematic diagram of the different cellular energy phenotypes of normal and tumor cells. All the data were presented as mean ± SEM. Error bars represent SEM, and statistical significance between groups was analyzed using an unpaired t-test. ** p < 0.01; *** p < 0.001.
Figure 2
Figure 2
Quantitative analysis of MitoQ enrichment in mitochondria among HA and A172 cells. (A) HPLC−MS chromatograms of MitoQ at different concentrations. (B) The calibration curve of MitoQ within the concentration range of 1−1000 ng/mL. The concentrations of MitoQ in whole cells and the isolated mitochondria of HA (C) and A172 cells (D).
Figure 3
Figure 3
Construction of PMMP using MitoQ. (A) Fluorescence of HA and A172 cells stained using JC-1 was ascertained through flow cytometry. (B) The activities of respiratory chain complexes I and III associated with proton production were determined with commercial kits. (C) The PPR was detected through a fast-responding pH electrode system after MitoQ treatment. (D) The schematic diagram of mitochondrial status changes after MitoQ treatment. Each experiment was conducted at least three times. All the data were presented as mean ± SEM. Error bars represent SEM, and statistical significance between groups was analyzed using an unpaired t-test. ** p < 0.01; *** p < 0.001.
Figure 4
Figure 4
MitoQ disrupted the TCA cycle in HA cells. Effect of MitoQ on metabolite expression in HA (A) and A172 cells (B), n = 6. The Fold Change (FC) analysis and t-test were utilized in volcano plot analysis to screen the potential metabolites. The red dots indicate differential metabolites with FC > 1.5, and p-value < 0.05, the blue dots reveal differential metabolites with FC < 0.67 and p-value < 0.05, and the black dots depict no significant difference. (C) Influence of MitoQ on citrate and L-malic acid expression within HA cells. (D) The expression of citrate and L-malic acid were negatively correlated within HA cells. KEGG analysis of metabolites pathway after MitoQ treatment using HA (E) and A172 cells (F).
Figure 5
Figure 5
MitoQ induced autophagy in HA cells through the AMPK/mTOR pathway. (A) The phosphorylation of AMPK and mTOR in HA and A172 cells were evaluated using Western blotting after treatment with MitoQ. (B) The conversion of LC3-I to LC3-II and the protein levels of SQSTM1/p62 were analyzed through Western blotting. The autophagosomes induced by MitoQ were visualized (C) and determined (D) by the high content imaging system. (E) Transmission electron microscopy was utilized to observe the autophagic vacuoles. (F) The autophagosome–lysosome fusions were visualized through confocal microscopy. Representative images were provided as indicated. Each experiment was conducted at least three times. All the data are presented as mean ± SEM; error bars represent SEM. Statistical significance between the groups was analyzed using unpaired t-test. * p < 0.05; ** p < 0.01; *** p < 0.001; “ns” represents no statistical difference.
Figure 6
Figure 6
The protective effect of MitoQ on HA cells against X-ray radiation. (A) Effects of different concentrations of MitoQ on HA and A172 cells during X-ray radiation were detected through CCK8 assays. (B) MitoQ at a concentration of 0.5 μM promoted the proliferation of HA cells during 4 Gy X-ray radiation in CCK8 assays. (C) EdU assay demonstrated that MitoQ could protect HA cells from damage using X-rays. Typical photos of the EdU assay were captured with confocal microscopy (E,F). (D) Autophagy inhibitor ROC-325 destroyed the protective effect of MitoQ on HA cells. (G) ROC-325 restrained the autophagy flux. Representative images were provided as indicated. All the data are presented as mean ± SEM from at least three independent experiments, and error bars represent SEM. Statistical significance between groups was analyzed using one-way ANOVA, * p < 0.05; ** p < 0.01; *** p < 0.001; “ns” represents no statistical difference.
Figure 7
Figure 7
Protective effect of MitoQ on normal tissues against X-rays among mice bearing orthotopic glioma. HPLC-MS chromatograms of MitoQ inside the brain (A) and blood (B) of both the i.p. and ig. group, n = 5. (C) MALDI-TOF-MS was used to visualize the spatial distribution of MitoQ on the surface of brain tissue sections. The intensity box blot (D) and the representative MALDI-TOF-MS mass profile (583 m/z) (E,F) of MitoQ on the surface of the brain tissue sections were observed. The isotopic peaks of the MitoQ procured from MALDI-TOF-MS were also shown (F). (G) Schematic diagram illustrating the experimental design. Bioluminescence imaging was used to determine the tumor size of the nude mice bearing luciferase-positive U87MG orthotopic brain tumors on Day 1 (before treatment). The mice were intraperitoneally injected using MitoQ (10 mg/kg/day) for four days (Day 2–Day 5). The mice received 16 Gy X-ray whole-brain radiation on Day 4, two hours after MitoQ administration. MR imaging and TUNEL staining were performed on Day 5, and MR imaging and H&E staining were performed on Day 11. (H) The tumors were evaluated by bioluminescence before treatment, and MRI signals in the brain were monitored 24 h post-X-ray radiation. (I) TUNEL-stained sections were obtained at 24 h post-X-ray radiation. (J) The tumors were evaluated using bioluminescence before treatment, and MRI signals in the brain were detected seven days post-X-ray radiation. Red arrows indicate tumors, orange indicates edema, and green indicates hydrocephalus. (K) H&E staining of brain tissue on seven days post-X-ray irradiation. n = 5, Representative images were provided as shown.

Similar articles

Cited by

References

    1. Hamblin R., Vardon A., Akpalu J., Tampourlou M., Spiliotis I., Sbardella E., Lynch J., Shankaran V., Mavilakandy A., Gagliardi I., et al. Risk of second brain tumour after radiotherapy for pituitary adenoma or craniopharyngioma: A retrospective, multicentre, cohort study of 3679 patients with long-term imaging surveillance. Lancet Diabetes Endocrinol. 2022;10:581–588. doi: 10.1016/S2213-8587(22)00160-7. - DOI - PubMed
    1. Hong Z., Liu T., Wan L., Fa P., Kumar P., Cao Y., Prasad B., Qiu Z., Liu J., Wang H., et al. Targeting Squalene Epoxidase Interrupts Homologous Recombination via the ER Stress Response and Promotes Radiotherapy Efficacy. Cancer Res. 2022;82:1298–1312. doi: 10.1158/0008-5472.CAN-21-2229. - DOI - PMC - PubMed
    1. Kim S.H., Lim K.H., Yang S., Joo J.Y. Long non-coding RNAs in brain tumors: Roles and potential as therapeutic targets. J. Hematol. Oncol. 2021;14:77–94. doi: 10.1186/s13045-021-01088-0. - DOI - PMC - PubMed
    1. De Ruysscher D., Niedermann G., Burnet N.G., Siva S., Lee A.W.M., Hegi-Johnson F. Radiotherapy toxicity. Nat. Rev. Dis. Prim. 2019;5:13–33. doi: 10.1038/s41572-019-0064-5. - DOI - PubMed
    1. ClinicalTrials.gov: A Database of Privately and Publicly Funded Clinical Studies Conducted around the World. [(accessed on 13 December 2022)]; Available online: https://clinicaltrials.gov/ct2/results?cond=Radiation+Protection+and+can...