. 2023 Feb 15;12(2):489.
doi: 10.3390/antiox12020489.

Itaconate Suppresses the Activation of Mitochondrial NLRP3 Inflammasome and Oxidative Stress in Allergic Airway Inflammation

Affiliations

Itaconate Suppresses the Activation of Mitochondrial NLRP3 Inflammasome and Oxidative Stress in Allergic Airway Inflammation

Qiu-Meng Xie et al. Antioxidants (Basel). .

Abstract

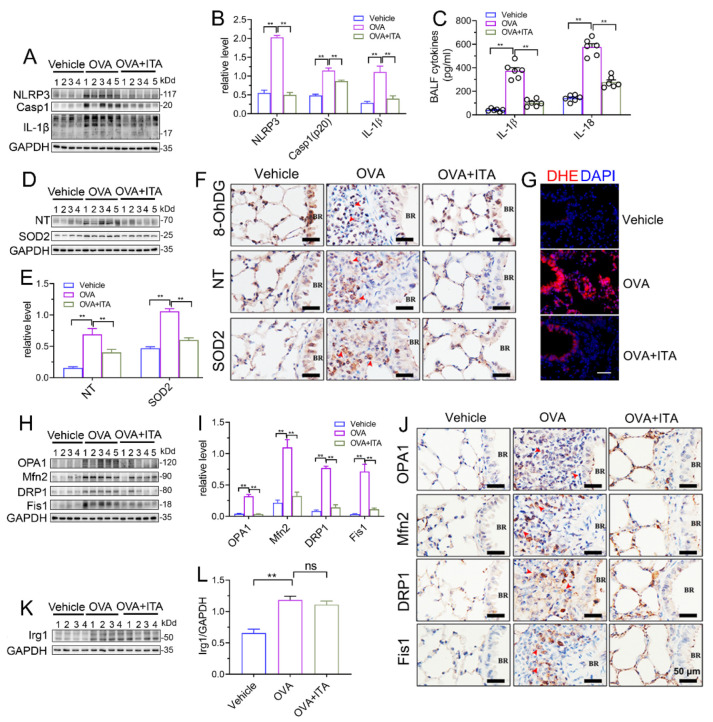
Itaconate has emerged as a novel anti-inflammatory and antioxidative endogenous metabolite, yet its role in allergic airway inflammation (AAI) and the underlying mechanism remains elusive. Here, the itaconate level in the lung was assessed by High Performance Liquid Chromatography (HPLC), and the effects of the Irg1/itaconate pathway on AAI and alveolar macrophage (AM) immune responses were evaluated using an ovalbumin (OVA)-induced AAI model established by wild type (WT) and Irg1-/- mice, while the mechanism of this process was investigated by metabolomics analysis, mitochondrial/cytosolic protein fractionation and transmission electron microscopy in the lung tissues. The results demonstrated that the Irg1 mRNA/protein expression and itaconate production in the lung were significantly induced by OVA. Itaconate ameliorated while Irg1 deficiency augmented AAI, and this may be attributed to the fact that itaconate suppressed mitochondrial events such as NLRP3 inflammasome activation, oxidative stress and metabolic dysfunction. Furthermore, we identified that the Irg1/itaconate pathway impacted the NLRP3 inflammasome activation and oxidative stress in AMs. Collectively, our findings provide evidence for the first time, supporting the conclusion that in the allergic lung, the itaconate level is markedly increased, which directly regulates AMs' immune responses. We therefore propose that the Irg1/itaconate pathway in AMs is a potential anti-inflammatory and anti-oxidative therapeutic target for AAI.

Keywords: Irg1; NLRP3 inflammasome; allergic airway inflammation; alveolar macrophage; itaconate; mitochondrial; oxidative stress.


Conflict of interest statement

The authors declare that they have no competing interests.

Figures

Figure 1
Figure 1
Itaconate level and Irg1 expression are induced in OVA−induced allergic airway inflammation. (A) Representative images of BALF cells stained with Wright–Giemsa solution. Scale bar: 50 μm. (B) The number of total inflammatory cells, eosinophils, macrophages, neutrophils and lymphocytes in BALF. (C) The optical density value (OD value) measured at 450 nm represents the level of IgE in serum. (D) The level of Th2 cytokines IL-5, IL-4 and IL-13 in BALF. (E) Representative blots showing the protein expressions of Th2 cytokines IL-5, IL-4 and IL-13 in lung tissues from vehicle and OVA groups. (F) Quantification of the expression of IL-5, IL-4 and IL-13 in the lung as referencing to GAPDH. (GJ) TCA organic acid metabolomics analysis in vehicle and OVA group. n = 3 per group. (G) Principal component analysis (PCA) in vehicle and OVA group. (H) Heatmap of metabolites obtained by TCA organic acid metabolomics analysis in vehicle and OVA group. (I) Fold change of metabolites in OVA group as compared with vehicle group. (J) The level of itaconate in lung tissue. (K) The mRNA expression of Irg1 in lung tissue. (L) Representative blots showing the protein expressions of Irg1 in lung tissues from vehicle and OVA groups and quantification. Cropped blots are shown, and Supplementary File S2: Figures S1 and S2 present the full-length blots. Data expressed as means ± SEM (n = 6). ** p < 0.01.
Figure 2
Figure 2
Exogenous itaconate attenuates OVA−induced allergic airway inflammation. (A) Protocol for the establishment of OVA-induced allergic airway inflammation and treatment of itaconate. (B) Representative whole lung sections stained with HE and PAS, scale bar: 500 μm. A magnified version of the panel can be found in Supplementary File S1: Figure S3. (C) Representative images of BALF cells stained with Wright–Giemsa solution. E: red arrows indicate eosinophils, M: green arrow indicates macrophage and N: blue arrow indicates neutrophil. Scale bar: 100 μm. (D) The number of total inflammatory cells, eosinophils, macrophages, neutrophils and lymphocytes in BALF. (E) The optical density value (OD value) measured at 450 nm represents the level of IgE in serum. (F) The level of Th2 cytokines IL-5, IL-4 and IL-13 in BALF. (G) Representative blots showing the protein expressions of Th2 cytokines IL-5, IL-4 and IL-13 in lung tissues from vehicle, OVA and OVA+ITA groups. (H) Quantification of the expression of IL-5, IL-4 and IL-13 in the lung as referencing to GAPDH. Cropped blots are shown, and Supplementary File S2: Figure S3 presents the full-length blots. Data expressed as means ± SEM (n = 6). ** p < 0.01.
Figure 3
Figure 3
Allergic airway inflammation is augmented in OVA−challenged Irg1−/− mice. (A) Representative histogram showing the purity of isolated AMs gated on CD45+F4/80+CD11bCD11c+. (B) Representative images of isolated AMs stained with Wright–Giemsa solution. Scale bar: 25 μm. (C) Western blot showing Irg1 protein induction in isolated AMs from WT and Irg1−/− mice and stimulated with OVA (500 ng/mL) for 24 h. (D) Representative whole lung sections stained with HE and PAS; scale bar: 500 μm. (E) Representative images of BALF cells stained with Wright–Giemsa solution. Scale bar: 50 μm. (F) The number of total inflammatory cells, eosinophils, macrophages, neutrophils and lymphocytes in BALF. (G) The optical density value (OD value) measured at 450 nm represents the level of IgE in serum. (H) The level of Th2 cytokines IL-5, IL-4 and IL-13 in BALF. (I) Representative blots showing the protein expressions of Th2 cytokines IL-5, IL-4 and IL-13 in lung tissues from WT and Irg1−/− mice challenged with OVA. (J) Quantification of the expression of IL-5, IL-4 and IL-13 in the lung as referencing to GAPDH. Cropped blots are shown, and Supplementary File S2: Figures S4 and S5 present the full-length blots. Data expressed as means ± SEM (n ≥ 6). ** p < 0.01.
Figure 4
Figure 4
Itaconate suppresses NLRP3 inflammasome activation, oxidative stress and mitochondrial dynamics in allergic airway inflammation. (A) Representative blots of NLPR3, Caspase-1 (p20) and IL-1β (p17) in lung tissue. (B) Quantification of the expression of NLPR3, Caspase-1 (p20) and IL-1β (p17) in the lung as referencing to GAPDH. (C) The level of IL-1β and IL-18 in BALF. (D) Representative blots of nitrotyrosine (NT) and SOD2 in lung tissue. (E) Quantification of the expression of nitrotyrosine (NT) and SOD2 in the lung as referencing to GAPDH. (F) Representative lung sections of the immunohistologic staining of 8-OHdG, nitrotyrosine and SOD2; red arrows indicate the immunopositive cells; scale bar: 50 μm. (G) Representative lung sections of DHE staining; scale bar: 50 μm. (H) Representative blots of OPA1, Mfn2, DRP1 and Fis1 in lung tissue. (I) Quantification of the expression of OPA1, Mfn2, DRP1 and Fis1 in the lung as referencing to GAPDH. (J) Representative lung sections of the immunohistologic staining of OPA1, Mfn2, DRP1 and Fis1; red arrows indicate the immunopositive cells; scale bar: 50 μm. (K) Representative blots of Irg1 in lung tissue. (L) Quantification of the expression of Irg1 in the lung as referencing to GAPDH. Cropped blots are shown, and Supplementary File S2: Figures S6–S9 presents the full-length blots. Data expressed as means ± SEM (n = 6). ** p < 0.01, ns: no significant difference.
Figure 5
Figure 5
Itaconate suppresses mitochondrial NLRP3 inflammasome activation, oxidative stress and mitochondrial dynamics in allergic airway inflammation. (A) Protocol for mitochondrial and cytosolic protein fractionation of lung tissue. (B) Representative blots of COX IV in the mitochondrial and cytosolic fractions. (C) Representative blots of NLPR3, Caspase-1 (p20) and IL-1β (p17) in cytosolic (c) and mitochondrial (m) fraction of lung tissue. (D) Quantitative analysis of NLPR3, Caspase-1 (p20) and IL-1β (p17) in cytosolic and mitochondrial fraction. (E) Representative blots of nitrotyrosine (NT) and SOD2 in cytosolic and mitochondrial fraction of lung tissue. (F) Quantitative analysis of nitrotyrosine and SOD2 in the mitochondrial and cytosolic fractions. Cropped blots are shown, and Supplementary File S2: Figures S10–S12 presents the full-length blots. Data expressed as means ± SEM (n = 6). * p < 0.05, ** p < 0.01.
Figure 6
Figure 6
Itaconate regulates energy metabolism and mitochondrial morphology in allergic airway inflammation. (A) Schematic overview of metabolites involved in glycolysis and TCA cycle. (B) Heatmap showing relative levels of glycolysis and TCA cycle intermediate metabolites in vehicle, OVA and OVA+ITA group (three mice per group). (C) Fold change of glycolysis and TCA cycle metabolites in OVA group as compared with vehicle group. (D) Fold change of glycolysis and TCA cycle metabolites in OVA+ITA group as compared with OVA group. (E) Representative lung section showing mitochondrial morphological changes in epithelial cells. Scale bar: 1 μm. (F) Representative lung section showing mitochondrial morphology changes in lung macrophages. Scale bar: 2 μm. (G,H) The rates of abnormal mitochondria in epithelial cell and macrophage from vehicle, OVA and OVA+ITA group. Red arrowhead indicates cavity formation, blue arrowhead indicates black dense compact, yellow arrowhead indicates crista loss and rupture and green arrowhead indicates swelling. Data expressed as means ± SEM (n = 3). * p < 0.05, ** p < 0.01, *** p < 0.001.
Figure 7
Figure 7
Itaconate inhibits the activation of NLRP3 inflammasome, oxidative stress and mitochondrial fusion/fission in BALF alveolar macrophages. (A) Representative lung sections of the immunohistologic staining of F4/80 in vehicle and OVA mice; scale bar: 50 μm. (B) Representative double immunofluorescent staining of F4/80 and Irg1 in BALF AMs from vehicle and OVA group. Scale bar: 20 μm. (C) Representative blots of Irg1 in BALF AMs from vehicle and OVA mice. (D) Representative blots of NLPR3, Caspase-1 (p20) and IL-1β (p17) in BALF AMs from vehicle, OVA and OVA+ITA mice. (E) Representative blots of nitrotyrosine (NT) and SOD2 in BALF AMs from vehicle, OVA and OVA+ITA mice. (F) Representative blots of OPA1, Mfn2, DRP1 and Fis1 in BALF AMs from vehicle, OVA and OVA+ITA mice. (G) Quantitative analysis of NLPR3, Caspase-1 (p20), IL-1β (p17), nitrotyrosine (NT), SOD2, OPA1, Mfn2, DRP1 and Fis1 in AMs from vehicle, OVA and OVA+ITA group. (H) Representative blots of NLPR3, Caspase-1 (p20) and IL-1β (p17) in BALF AMs from OVA and Irg1−/− OVA mice. (I) Representative blots of nitrotyrosine (NT) and SOD2 in BALF AMs from OVA and Irg1−/− OVA mice. (J) Representative blots of OPA1, Mfn2, DRP1 and Fis1 in BALF AMs from OVA and Irg1−/− OVA mice. (K) Quantitative analysis of NLPR3, Caspase-1 (p20), IL-1β (p17), nitrotyrosine (NT), SOD2, OPA1, Mfn2, DRP1 and Fis1 in AMs from vehicle, OVA and OVA+ITA group. For Western blot, n = 3 per group, each replicate pooled cells from three to five mice in vehicle and OVA+ITA group, while in OVA and Irg1−/− OVA group, each replicate represented one mouse; before seeding, the cell number was counted to ensure that the adherent AMs number will be no less than 2.5 × 10⁵ cells/well. Cropped blots are shown, and Supplementary File S2: Figures S13–S23 presents the full-length blots. * p < 0.05, ** p < 0.01.

Similar articles

Cited by

References

    1. GINA Executive and Science Committee Global Strategy for Asthma Management and Prevention 2021. 2021. [(accessed on 3 May 2022)]. Available online: https://ginasthma.org/gina-reports/
    1. El-Husseini Z.W., Gosens R., Dekker F., Koppelman G.H. The genetics of asthma and the promise of genomics-guided drug target discovery. Lancet Respir. Med. 2020;8:1045–1056. doi: 10.1016/S2213-2600(20)30363-5. - DOI - PubMed
    1. Heffler E., Madeira L.N.G., Ferrando M., Puggioni F., Racca F., Malvezzi L., Passalacqua G., Canonica G.W. Inhaled Corticosteroids Safety and Adverse Effects in Patients with Asthma. J. Allergy Clin. Immunol. Pract. 2018;6:776–781. doi: 10.1016/j.jaip.2018.01.025. - DOI - PubMed
    1. Michelucci A., Cordes T., Ghelfi J., Pailot A., Reiling N., Goldmann O., Binz T., Wegner A., Tallam A., Rausell A., et al. Immune-responsive gene 1 protein links metabolism to immunity by catalyzing itaconic acid production. Proc. Natl. Acad. Sci. USA. 2013;110:7820–7825. doi: 10.1073/pnas.1218599110. - DOI - PMC - PubMed
    1. Lampropoulou V., Sergushichev A., Bambouskova M., Nair S., Vincent E.E., Loginicheva E., Cervantes-Barragan L., Ma X., Huang S.C., Griss T., et al. Itaconate Links Inhibition of Succinate Dehydrogenase with Macrophage Metabolic Remodeling and Regulation of Inflammation. Cell Metab. 2016;24:158–166. doi: 10.1016/j.cmet.2016.06.004. - DOI - PMC - PubMed

LinkOut - more resources