. 2023 Feb 4;13(4):553.
doi: 10.3390/ani13040553.

Growth Stages and Inter-Species Gut Microbiota Composition and Function in Captive Red Deer (Cervus elaphus alxaicus) and Blue Sheep (Pseudois nayaur)

Affiliations

Growth Stages and Inter-Species Gut Microbiota Composition and Function in Captive Red Deer (Cervus elaphus alxaicus) and Blue Sheep (Pseudois nayaur)

Yao Zhao et al. Animals (Basel). .

Abstract

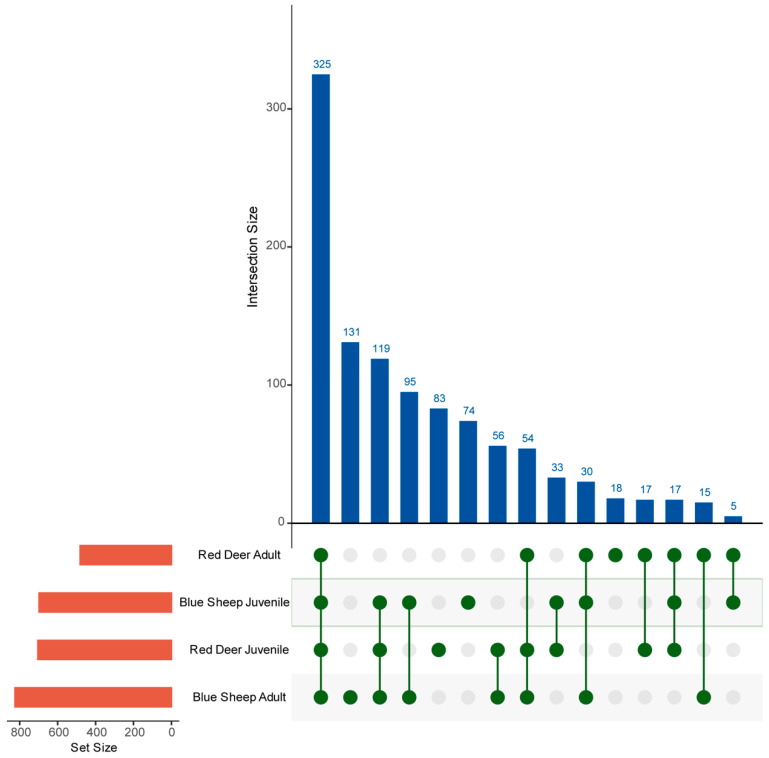
Blue sheep and red deer, second-class key protected animals in China, are sympatric species with a high degree of overlap of food resources in the Helan Mountains, China. Previous studies with blue sheep and red deer in nature have shown that their physiology is closely related to their gut microbiota. However, growth stages and changes occurring in these species in captivity are still unknown. Thus, 16S rRNA gene sequencing was used to explore diversity, composition and function of the gut microbiota in these two animal species. The diversity and structure of the gut microbiota in captive blue sheep and red deer changed at different growth stages, but the dominant microbiota phyla in the gut microbiota remained stable, which was composed of the phyla Firmicutes, Bacteroidetes and Verrucomicrobia. Moreover, gut microbiota diversity in juvenile blue sheep and red deer was low, with the potential for further colonization. Functional predictions showed differences such as red deer transcription being enriched in adults, and blue sheep adults having a higher cell wall/membrane/envelope biogenesis than juveniles. Microbial changes between blue sheep and red deer at different growth stages and between species mainly depend on the abundance of the microbiota, rather than the increase and absence of the bacterial taxa.

Keywords: 16S rRNA gene sequencing; blue sheep; captivity; growth stage; gut microbes; red deer.


Conflict of interest statement

The authors declare no conflict of interest.

Figures

Figure 1
Figure 1
Core operational taxonomic units (OTUs) in the gut microbiome of captive blue sheep and red deer. Each dot refers to a sample group. Dots are visible below the graph, represent the number of core OTUs common to all microbial taxa and the proportion of each dot that does not overlap represents the number of specific OTUs.
Figure 2
Figure 2
Dynamic changes in alpha-diversity metrics of the gut microbiota of captive blue sheep and red deer. (A) ACE index; (B) Chao1 index. All values are reported as mean ± SD, in which * indicates statistical significance (p < 0.05).
Figure 3
Figure 3
Combined analyses of non-metric multidimensional scaling (NMDS) (AC) and Anosim (DF) analyses of the gut microbiota of captive blue sheep and red deer based on unweighted Unifrac distance at the genus level. Anosim indicates significant differences between samples at different growth stages or not.
Figure 4
Figure 4
Composition of the gut microbiota of captive red deer and blue sheep at the (A) phylum and (B) genus level at different growth stages. Each percentage band indicates the ranking of bacterial species according to their relative abundance in each group.
Figure 5
Figure 5
Differences in the trend in the top 20 genera in the gut microbiota of captive blue sheep and red deer in different growth stages. The y-axis represents the genus, and the x-axis represents the abundance of the genus at different growth stages or inter-species. (A) Red deer; (B) blue sheep; (C) inter-species (red deer and blue sheep) comparison. (* p < 0.05).
Figure 6
Figure 6
Distribution of linear discriminant analysis (LDA) scores. The ordinate indicates the taxon with significant differences between groups; the abscissa corresponds to the logarithmic LDA scores based on taxonomic analysis. (A) Differential microbial species in the gut microbiota of blue sheep; (B) differential microbial species in the gut microbiota of red deer; (C) differential microbial species in the gut microbiota between species.
Figure 7
Figure 7
Community structure of the gut microbiota of captive blue sheep and red deer based on βNTI and RCbray calculations to indicate randomness or determinism models in the microbial community assembly. (A) βNTI/RCbray community structure analysis of all groups; (B) community structure analysis of the gut microbiota of red deer; (C) community structure analysis of the gut microbiota of blue sheep; (D) community structure analysis of the gut microbiota between species.
Figure 8
Figure 8
Co-occurrence network analysis of gut microbiota communities in captive red deer (A) and blue sheep (C). Zi-Pi map based on node features of the gut microbiota community of red deer (B) and blue sheep (D). The blue edge represents a positive correlation; the yellow edge represents a negative correlation. Each circle or node represents a genus, node colors indicate different microbial communities.
Figure 9
Figure 9
KEGG metabolic pathway analysis between second-level categories. (A) Comparison of the gut microbiota of juvenile and adult blue sheep; (B) Inter-species comparison of the functions of the gut microbiota. Different colors indicate different groups. On the left side of the figure is shown the abundance ratio of different functions in the two sample groups; in the middle is shown the different rate of function abundance with a 95% confidence interval; on the right side, p values are reported.
Figure 10
Figure 10
Clusters of Orthologous Groups (COG) functional analysis of the gut microbiome of captive blue sheep and red deer. (A) Comparison between juvenile and adult red deer; (B) comparison between juvenile and adult blue sheep and (C) comparison between blue sheep and red deer.

References

    1. Wang B., Liu X., Bian Y., Sun G., Wang H., Zhang J., Zhang Z., Zou X. Correlation analysis of breast fibroadenoma and the intestinal flora based on 16S rRNA sequencing. Oncol. Transl. Med. 2021;7:269–274.
    1. Franza L., Carusi V., Altamura S., Gasbarrini A., Caraffa A., Kritas S.K., Ronconi G., Gallenga C.E., Di Virgilio F., Pandolfi F. Gut microbiota and immunity in common variable immunodeficiency: Crosstalk with pro-inflammatory cytokines. J. Biol. Regul. Homeost. Agents. 2019;33:315–319. - PubMed
    1. Shipo L., Xing H., Liyun G., Li S.P., Heng X., Guo L.Y., Lessing D.J., Chu W.H. SCFAs improve disease resistance via modulate gut microbiota, enhance immune response and increase antioxidative capacity in the host. Fish Shellfish Immunol. 2022;120:560–568. - PubMed
    1. Tsegay T., Xuexiang W., Qiang H., Qianwen D., Hongliang L., Chao R., Yalin Y., Liqiu X., Shaojun W., Zhigang Z., et al. Dietary SWF® enhanced growth performance and disease resistance in hybrid sturgeon (Acipenser baerii × Acipenser schrenckii) mediated by the gut microbiota. Aquac. Rep. 2020;17:100346.
    1. Wang H., Xu R., Zhang H., Zhu W. Swine gut microbiota and its interaction with host nutrient metabolism. Anim. Nutr. 2020;6:410–420. - PMC - PubMed

LinkOut - more resources