

Comprehensive Comparative Analysis Sheds Light on the Patterns of Microsatellite Distribution across Birds Based on the Chromosome-Level Genomes
- PMID: 36830442
- PMCID: PMC9951716
- DOI: 10.3390/ani13040655
Comprehensive Comparative Analysis Sheds Light on the Patterns of Microsatellite Distribution across Birds Based on the Chromosome-Level Genomes
Abstract
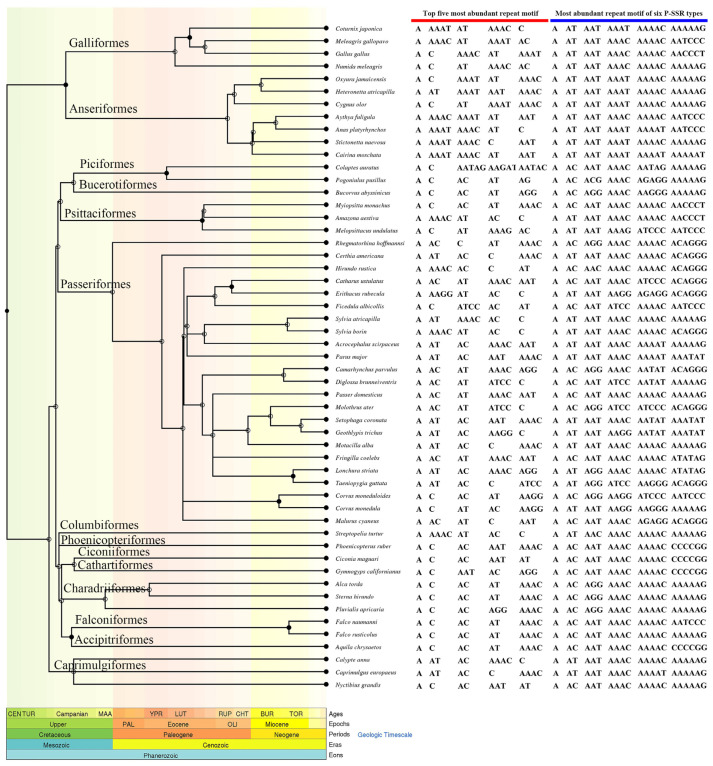
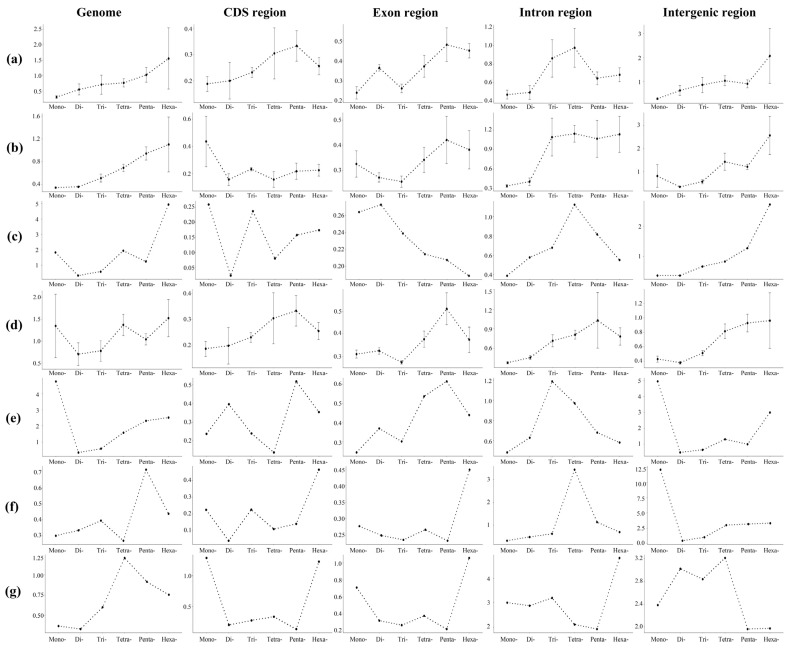
Microsatellites (SSRs) are widely distributed in the genomes of organisms and are an important genetic basis for genome evolution and phenotypic adaptation. Although the distribution patterns of microsatellites have been investigated in many phylogenetic lineages, they remain unclear within the morphologically and physiologically diverse avian clades. Here, based on high-quality chromosome-level genomes, we examined the microsatellite distribution patterns for 53 birds from 16 orders. The results demonstrated that each type of SSR had the same ratio between taxa. For example, the frequency of imperfect SSRs (I-SSRs) was 69.90-84.61%, while perfect SSRs (P-SSRs) were 14.86-28.13% and compound SSRs (C-SSRs) were 0.39-2.24%. Mononucleotide SSRs were dominant for perfect SSRs (32.66-76.48%) in most bird species (98.11%), and A(n) was the most abundant repeat motifs of P-SSRs in all birds (5.42-68.22%). Our study further confirmed that the abundance and diversity of microsatellites were less effected by evolutionary history but its length. The number of P-SSRs decreased with increasing repeat times, and longer P-SSRs motifs had a higher variability coefficient of the repeat copy number and lower diversity, indicating that longer motifs tended to have more stable preferences in avian genomes. We also found that P-SSRs were mainly distributed at the gene ends, and the functional annotation for these genes demonstrated that they were related to signal transduction and cellular process. In conclusion, our research provided avian SSR distribution patterns, which will help to explore the genetic basis for phenotypic diversity in birds.
Keywords: birds; chromosome-level genome; distribution pattern; functional annotation; microsatellite.
Conflict of interest statement
The authors declare that they have no conflict of interest.
Figures


References
-
- Qi W.-H., Lu T., Zheng C.-L., Jiang X.-M., Jie H., Zhang X.-Y., Yue B.-S., Zhao G.-J. Distribution patterns of microsatellites and development of its marker in different genomic regions of forest musk deer genome based on high throughput sequencing. Aging. 2020;12:4445–4462. doi: 10.18632/aging.102895. - DOI - PMC - PubMed
Grants and funding
LinkOut - more resources
Full Text Sources
