. 2023 Feb 11;13(2):354.
doi: 10.3390/biom13020354.

In Vivo Protein-Protein Binding Competition Assay Based on Split-GFP Reassembly: Proof of Concept

Affiliations

In Vivo Protein-Protein Binding Competition Assay Based on Split-GFP Reassembly: Proof of Concept

Christophe Bignon et al. Biomolecules. .

Abstract

The split-green fluorescent protein (GFP) reassembly assay is a well-established approach to study protein-protein interactions (PPIs). In this assay, when two interacting proteins X and Y, respectively fused to residues 1-157 and to residues 158-237 of GFP, are co-expressed in E. coli, the two GFP halves are brought to sufficient proximity to reassociate and fold to recreate the functional GFP. At constant protein expression level, the intensity of fluorescence produced by the bacteria is proportional to the binding affinity of X to Y. We hypothesized that adding a third partner (Z) endowed with an affinity for either X or Y would lead to an in vivo competition assay. We report here the different steps of the set-up of this competition assay, and define the experimental conditions required to obtained reliable results. Results show that this competition assay is a potentially interesting tool for screening libraries of binding inhibitors, Z being either a protein or a chemical reagent.

Keywords: binding competition assays; fluorescence; intrinsically disordered proteins; protein complementation assays; protein–protein interactions.


Conflict of interest statement

The authors declare no conflict of interest. The funders had no role in the design of the study; in the collection, analyses, or interpretation of data; in the writing of the manuscript; or in the decision to publish the results.

Figures

Figure 1
Figure 1
(A) GFP topology diagram. β-strands are numbered and represented as grey arrows, α-helices are represented as green cylinders and loops as red lines. The internal α-helix containing the chromophore is represented behind the structure. N, N-terminus. C, C-terminus. The cutting point between residues 157 and 158 is indicated. (B) Split-GFP reassociation. Cartoon representation illustrating how NGFP (1–157) and CGFP (158–238) reassociate to recreate the fluorescent protein. (C) Cartoon representation of the complex resulting from the assembly of NGFP-X and Y-CGFP fusion proteins, in this example X being measles virus NTAIL, and Y XD.
Figure 2
Figure 2
(A) Schematic representation of measles virus NTAIL (upper panel) and cartoon representation of an NTAIL conformer generated using Flexible-Mecano [22]. (B) Ribbon representation of the crystal structure of measles virus XD (PDB code 1OKS). (C) Cartoon representation of the crystal structure of HSP70 based on pdb codes 1HJO and 4JNF. The relative orientation of the two hsp70 domains (i.e., amino acids 3–382 and amino acids 389–610) is based on the structure of a form encompassing residues 1–554 (pdb code 1YUW). (D) Structure of the complex between measles virus XD (blue) and of the MoRE of NTAIL (red, aa 486–504) (PDB code 1T6O). The buried surface area of the XD/MoRE complex is 634 Å2.
Figure 3
Figure 3
Principle of the Split-GFP-based competition assay. On the left panel is represented the split-GFP reassembly assay. Two proteins X and Y known to interact are respectively fused to the N-terminal (NGFP) and to the C-terminal part of GFP (CGFP), and co-expressed in E. coli by their respective plasmid. The plasmid coding for NGFP fusion confers ampicillin resistance and expression is induced by IPTG. The plasmid coding for CGFP fusion confers kanamycin resistance and expression is induced by arabinose. When protein X binds to protein Y, their two GFP halves are brought together and reconstitute the functional GFP. On the right panel, a competitor Z is co-expressed with NGFP-X and Y-CGFP. The plasmid coding for Z confers tetracycline resistance and Z expression is induced by IPTG. Z binds to X, which reduces the amount of NGFP-X fusion protein available for binding to Y-CGFP, and hence reduces the amount of fluorescence produced by the bacteria.
Figure 4
Figure 4
Split-GFP reassembly competition assay using NGFP-471, XD-CGFP, and His-471 as competitor. (A,B) Fluorescence data obtained in two independent experiments, each performed in triplicate for 24, 48, or 72 h. NSTS and NST4 are the two negative controls. See main text for a description of NSTS, NST4, N4TS, and N4T4. (C,D) SDS-PAGE analysis of (A,B), respectively. M, molecular mass markers (200, 150, 100, 85, 60, 50, 40, 30, 25, 20, 15, 10 kDa).
Figure 5
Figure 5
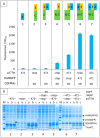
XDCGFP bound to 471 and/or NGFP is protected from degradation as assessed by fluorescence measurements after one night at 17 °C and SDS-PAGE analysis. In this experiment, XDCGFP is his-tagged. (A) Top panel: the different proteins and protein combinations, numbered from 1 to 7, are illustrated by colored rectangles: 471 = 4 in blue rectangle, XD = X in yellow rectangle, CGFP = C in green rectangle, NGFP = N in green rectangle. Fusion proteins XC and 4N are represented as fused rectangles. To avoid ambiguity, competitor 471 bound to XD is arbitrarily represented on the right of XD, whereas NGFP471 bound to XDCGFP is arbitrarily represented on the left of XDCGFP. Bottom panel: fluorescence data obtained with conditions 1 to 7 are represented just below the corresponding protein or protein combinations 1 to 7. (B) SDS-PAGE analysis of proteins expressed in (A). Triplicates were loaded individually (a, b, c) to assess the reproducibility of each loading. The lowest steady-state level of XD-CGFP is indicated by an oblique arrow (condition 2). His-NGFP is indicated by square brackets. Numbers 1 to 7 below the gels refer to the different combinations of (A). The different fusion proteins are indicated on the right of the gels. M, molecular mass markers (200, 150, 100, 85, 60, 50, 40, 30, 25, 20, 15, 10 kDa).
Figure 6
Figure 6
Explanation of Figure 4 results. Left panel, cartoon explaining the different protein interactions and the corresponding fluorescence results. XD-CGFP and NGFP-471 fusion proteins are represented as linked rectangles. Non-fluorescent proteins are shown in black. Fluorescent proteins are in green. The green border thickness is proportional to the intensity of fluorescence. The thin blue arrow points towards the final complex. Thick blue double arrow: fast, reversible interaction. Orange arrow: slow, irreversible interaction. To avoid any ambiguity, free 471 bound to XD is represented on the right of XD, whereas NGFP-471 bound to XD-CGFP is represented on the left of XD-CGFP. See main text for a description of NSTS, NST4, N4TS and N4T4. Right panel, Fluorescence data of a triplicate experiment run overnight. Numbers 4 to 7 of the x-axis refer to the experimental conditions described in Figure 5.
Figure 7
Figure 7
Split-GFP reassembly competition assay using NGFP-471, XD-CGFP, and His-XD as competitor. (A) Fluorescence data as obtained from an experiment performed in triplicate for 24, 48 or 72 h. NSTS and NSTX are the two negative controls. TX is free XD used as competitor. See main text for a description of NSTS, NSTX, N4TS and N4TX. (B) SDS-PAGE analysis of (A). M, molecular mass markers (200, 150, 100, 85, 60, 50, 40, 30, 25, 20, 15, 10 kDa). (C) Fluorescence data as obtained from three independent experiments (labeled 1, 2, 3 on the x-axis), each performed in triplicate for 24 h. The difference between (A,C) is that experiments shown in (C) used a His-tagged version of XD-CGFP. (D) SDS-PAGE analysis of (C). M, molecular mass markers (200, 150, 100, 85, 60, 50, 40, 30, 25, 20, 15, 10 kDa).
Figure 8
Figure 8
Explanation of Figure 7 results. Left panel, cartoon explaining the different protein interactions and the corresponding fluorescence results. See Figure 6 for details and main text for a description of NSTS, NSTX, N4TS, and N4TX. The light grey arrow with a no-way symbol indicates an absence of interaction. Right panel, fluorescence data of a triplicate experiment run overnight. Numbers 4 to 7 of the x-axis refer to the experimental conditions described in Figure 5.
Figure 9
Figure 9
Split-GFP reassembly competition assay using NGFP-471 (A,B) or NGFP-hsbMoRE (C,D) with HSP-CGFP, and HSP as competitor. (A,C) Fluorescence data. (B,D) SDS-PAGE analysis of protein expression. See main text for a description of NSTS, NSTH, N4TS and N4TH. M, molecular mass markers (200, 150, 100, 85, 60, 50, 40, 30, 25, 20, 15, 10 kDa).
Figure 10
Figure 10
Explanation of Figure 9 results. The two top left and right bar plots are fluorescence data obtained by using 471 and hsbMoRE, respectively. See Figure 6 for details and main text for a description of NSTS, NSTH, N4TS, and N4TH. The light grey arrow with a no-way symbol indicates an absence of interaction.
Figure 11
Figure 11
Split-GFP reassembly competition assay using NGFP-hsbMoRE, HSP-CGFP, and hsbMoRE as competitor. Experimental conditions are the same as those described in Figure 9C, except that TH is replaced with TM (hsbMoRE competitor expressed by p17Tet). (A) Fluorescence data. (B) SDS-PAGE analysis of protein expression. M, molecular mass markers (200, 150, 100, 85, 60, 50, 40, 30, 25, 20, 15, 10 kDa).
Figure 12
Figure 12
Specificity of the competition using either NGFP-hsbMoRE with HSP-CGFP (A,C) or NGFP-471 with XD-CGFP (B,D). (A,B) Fluorescence data. (C,D) SDS-PAGE analysis of protein expression. Compared to previous Figures, a third negative control was added with the expression of an irrelevant protein (P, HeV PNT3) as competitor (TP). See main text for details. M, molecular mass markers (200, 150, 100, 85, 60, 50, 40, 30, 25, 20, 15, 10 kDa).

References

    1. Rao V.S., Srinivas K., Sujini G.N., Kumar G.N. Protein-protein interaction detection: Methods and analysis. Int. J. Proteom. 2014;2014:147648. doi: 10.1155/2014/147648. - DOI - PMC - PubMed
    1. Xing S., Wallmeroth N., Berendzen K.W., Grefen C. Techniques for the Analysis of Protein-Protein Interactions in Vivo. Plant Physiol. 2016;171:727–758. doi: 10.1104/pp.16.00470. - DOI - PMC - PubMed
    1. Musielak B., Janczyk W., Rodriguez I., Plewka J., Sala D., Magiera-Mularz K., Holak T. Competition NMR for Detection of Hit/Lead Inhibitors of Protein-Protein Interactions. Molecules. 2020;25:3017. doi: 10.3390/molecules25133017. - DOI - PMC - PubMed
    1. Luo Y., Granzhan A., Verga D., Mergny J.L. FRET-MC: A fluorescence melting competition assay for studying G4 structures in vitro. Biopolymers. 2021;112:e23415. doi: 10.1002/bip.23415. - DOI - PubMed
    1. Ralser M., Goehler H., Wanker E.E., Lehrach H., Krobitsch S. Generation of a yeast two-hybrid strain suitable for competitive protein binding analysis. BioTechniques. 2005;39:165–166, 168. doi: 10.2144/05392BM01. - DOI - PubMed

Publication types

MeSH terms

Substances

LinkOut - more resources