. 2023 Feb 20;13(2):399.
doi: 10.3390/biom13020399.

Single-Cell RNA-Seq Analysis Reveals Macrophages Are Involved in the Pathogenesis of Human Sporadic Acute Type A Aortic Dissection

Affiliations

Single-Cell RNA-Seq Analysis Reveals Macrophages Are Involved in the Pathogenesis of Human Sporadic Acute Type A Aortic Dissection

Bin Zhang et al. Biomolecules. .

Abstract

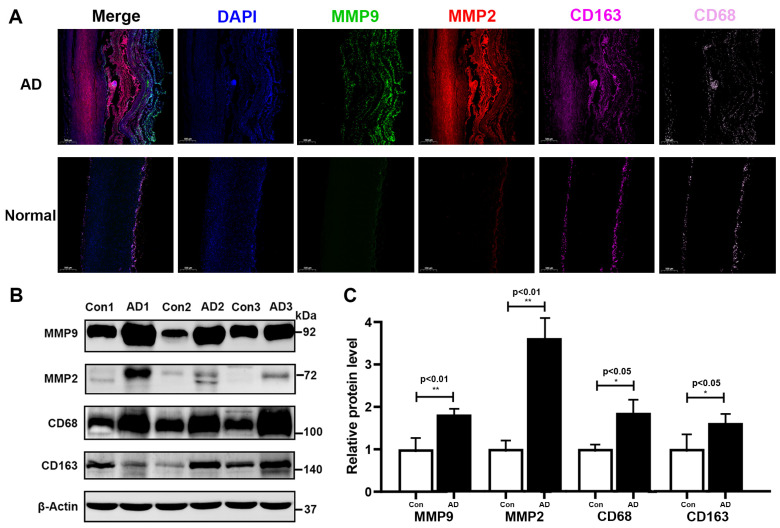
Macrophages play an important role in the progression of sporadic acute type A aortic dissection (ATAAD). The aim of this study was to characterize the cellular heterogeneity of macrophages in ATAAD tissues by scRNA-seq. Ascending aortic wall tissue from six ATAAD patients and three heart transplant donors was assessed by scRNA-seq and then analyzed and validated by various bioinformatic algorithms and histopathology experiments. The results revealed that the proportion of macrophages in ATAAD tissues (24.51%) was significantly higher than that in normal tissues (13.69%). Among the six macrophage subclusters, pro-inflammatory macrophages accounted for 14.96% of macrophages in the AD group and 0.18% in the normal group. Chemokine- and inflammation-related genes (CCL2, CCL20, S100A8, and S100A9) were expressed more intensively in macrophages in ATAAD tissue than in those in normal tissue. Additionally, intercellular communication analysis and transcription factor analysis indicated the activation of inflammation and degradation of the extracellular matrix in ATAAD tissue. Finally, immunohistochemistry, immunofluorescence, and Western blot experiments confirmed the overexpression of macrophage marker genes (CD68 and CD163) and matrix metalloproteinases (MMP9 and MMP2) in ATAAD tissue. Collectively, our study provides a preliminary evaluation of the role of macrophages in ATAAD, and the results could aid in the development of therapeutic options in the future.

Keywords: MMP2; MMP9; acute type A aortic dissection; inflammation; macrophage; matrix metalloproteinase; single-cell RNA sequencing.


Conflict of interest statement

The authors declare no conflict of interest.

Figures

Figure 1
Figure 1
Single-cell atlas of AD and normal ascending aorta samples. (A) Schematic diagram of the sample processing and experimental workflow employed. (B) UMAP plot of the 79,544 cells profiled, including ten main cell types in nine samples. Below the graph are legends color-coded by the assigned cell type. (C) UMAP plots of the AD group (six samples) and normal group (three samples). (D) Bar plot depicting the proportions of the ten main cell types in the AD and normal groups. (E) Heatmap of the top ten DEGs for the ten main cell types. (F) Dot plot of selected marker genes for each cell type. The dot size represents the percentage of cells expressing each gene, while the dot color represents the level of expression. UMAP, uniform manifold approximation and projection; DEGs, differentially expressed genes.
Figure 2
Figure 2
The heterogeneity of macrophages found in AD vs. normal aorta tissue. (A) UMAP plot of macrophages reclustered into six subclusters. (B) Bar plots of the proportion of macrophage subclusters in nine aortic samples. (C) Bar plots of the proportion of macrophage subclusters in the AD and normal groups. (D) The Monocle pseudotime trajectory plot shows the progression of six macrophage subclusters. (E) Monocle pseudotime trajectory plots of each macrophage subcluster. (F) The macrophage subcluster trajectory was separated into seven cell states. (G) Monocle pseudotime trajectory plot of macrophages presenting the beginning and end pseudotime profiles. (H) The macrophages trajectories in the AD and normal groups. (I) The heatmap shows the expression levels of genes grouped into three gene modules according to the pseudotime axis. (J) Pseudotime kinetics of the top six genes among the six macrophage subclusters. Each dot represents a cell, different colors represent different clusters, and the ordinate represents the expression level of each gene.
Figure 3
Figure 3
Distribution characteristics of differential genes in macrophages from the AD and normal groups. (A) Scatter plot of differential genes in macrophages between the AD group and the normal group. (B) Volcano plot of differential genes in macrophages for the AD group vs. the normal group. (C) GO enrichment analysis of DEGs. (D) Statistical bubble plot of GO enrichment analysis entries. The abscissa is the degree of enrichment, the ordinate is the GO entry, the size of the bubble represents the number of genes, and the color represents the p-value. (E) KEGG enrichment analysis of DEGs. (F) Statistical bubble plot of the KEGG enrichment analysis entries. The abscissa is the degree of enrichment, the ordinate is the KEGG entry, the size of the bubble represents the number of genes, and the color represents the p-value.
Figure 4
Figure 4
Cell–cell communication between macrophages and other cells in the AD group. (A) Network diagram of the weight and number of receptor–ligand interactions between the main cells. (B) Heatmap of the strength of communication between major cells. (C) Network diagram of communication between macrophages and other cells. (DF) Bubble plot of receptor–ligand pairs for communication between macrophages and T cells and endothelial cells and smooth muscle cells, respectively. (G) Bubble plot of the receptor–ligand pairs for the 10 major cell types.
Figure 5
Figure 5
Transcriptional regulation of the 10 main cell types in the AD and normal groups. (A) Heatmap indicating expression regulation by TFs analyzed with SCENIC in the 10 main cell types. The numbers between brackets indicate the (extended) regulons for the respective TFs. (B) t-SEN plot showing the cell type distribution based on a dimensionality reduction by 33 regulons. (C) t-SEN plot showing the sample distribution based on a dimensionality reduction by 33 regulons. (D) Characterization of the AUC of the macrophage-associated transcriptional regulon SPI1. TF regulon activities were quantified using the AUC. (E) Characterization of the AUC of the macrophage-associated transcriptional regulon CEBPB. TFs, transcription factors; SCENIC, single-cell regulatory network inference and clustering; t-SNE, t-distributed stochastic neighbor embedding.
Figure 6
Figure 6
Histopathological differences between AD and normal tissues. (AC) HE, Victoria Blue, and Masson’s trichrome staining were used to observe differences in the cellular structure, elastic fibers, and collagen fibers of ascending aorta sections from AD and normal participants. The image on the left shows an overview of the whole ascending aorta wall tissue (magnification: ×20). The three images on the right show magnifications of the adventitia, media, and intima of the ascending aortic wall, respectively (magnification: ×100). HE, hematoxylin–eosin.
Figure 7
Figure 7
Immunohistochemical analysis of macrophages and monocytes in sections of AD and normal samples. (A) CD14 antibody labeling showing the distribution of monocytes in tissues. (B) CD68 antibody labeling showing the distribution of macrophages in tissues. (C) CD86 antibody labeling showing the distribution of M1 macrophages in tissues. (D) CD163 antibody labeling showing the distribution of M2 macrophages in tissues. The image on the left shows an overview of the whole ascending aorta wall tissue (magnification: ×20). The three images on the right show magnifications of the adventitia, media, and intima of the ascending aortic wall, respectively (magnification: ×100).
Figure 8
Figure 8
Detection of macrophage markers and metallomatrix proteinases in AD and normal tissues. (A) Representative mIF images of normal and dissected human ascending aortas stained with DAPI (blue), MMP9 (green), MMP2 (red), CD163 (magenta), and CD68 (pink) (Magnification: ×20). (B) Western blotting experiments showing the protein expression levels of MMP9, MMP2, CD163, and CD68 in AD and normal tissues. (C) Bar graph of protein expression in AD tissue relative to normal tissue. * represents p < 0.05; ** represents p < 0.01. mIF: multiplexed immunofluorescence.

Similar articles

Cited by

References

    1. Harris K.M., Nienaber C.A., Peterson M.D., Woznicki E.M., Braverman A.C., Trimarchi S., Myrmel T., Pyeritz R., Hutchison S., Strauss C., et al. Early Mortality in Type A Acute Aortic Dissection: Insights From the International Registry of Acute Aortic Dissection. JAMA Cardiol. 2022;7:1009–1015. doi: 10.1001/jamacardio.2022.2718. - DOI - PMC - PubMed
    1. Nienaber C.A., Clough R.E. Management of acute aortic dissection. Lancet. 2015;385:800–811. doi: 10.1016/S0140-6736(14)61005-9. - DOI - PubMed
    1. Zhu Y., Lingala B., Baiocchi M., Tao J.J., Toro Arana V., Khoo J.W., Williams K.M., Traboulsi A.A., Hammond H.C., Lee A.M., et al. Type A Aortic Dissection-Experience Over 5 Decades: JACC Historical Breakthroughs in Perspective. J. Am. Coll. Cardiol. 2020;76:1703–1713. doi: 10.1016/j.jacc.2020.07.061. - DOI - PubMed
    1. Guo D.C., Hostetler E.M., Fan Y., Kulmacz R.J., Zhang D., Nickerson D.A., Leal S.M., LeMaire S.A., Regalado E.S., Milewicz D.M. Heritable Thoracic Aortic Disease Genes in Sporadic Aortic Dissection. J. Am. Coll. Cardiol. 2017;70:2728–2730. doi: 10.1016/j.jacc.2017.09.1094. - DOI - PMC - PubMed
    1. Ye J., Wang M., Jiang H., Ji Q., Huang Y., Liu J., Zeng T., Xu Y., Wang Z., Lin Y., et al. Increased levels of interleukin-22 in thoracic aorta and plasma from patients with acute thoracic aortic dissection. Clin. Chim. Acta Int. J. Clin. Chem. 2018;486:395–401. doi: 10.1016/j.cca.2017.10.033. - DOI - PubMed

Publication types