Review
. 2023 Jan 26;11(2):364.
doi: 10.3390/biomedicines11020364.

Magnetic Resonance Imaging of Primary Adult Brain Tumors: State of the Art and Future Perspectives

Affiliations
Review

Magnetic Resonance Imaging of Primary Adult Brain Tumors: State of the Art and Future Perspectives

Matia Martucci et al. Biomedicines. .

Abstract

MRI is undoubtedly the cornerstone of brain tumor imaging, playing a key role in all phases of patient management, starting from diagnosis, through therapy planning, to treatment response and/or recurrence assessment. Currently, neuroimaging can describe morphologic and non-morphologic (functional, hemodynamic, metabolic, cellular, microstructural, and sometimes even genetic) characteristics of brain tumors, greatly contributing to diagnosis and follow-up. Knowing the technical aspects, strength and limits of each MR technique is crucial to correctly interpret MR brain studies and to address clinicians to the best treatment strategy. This article aimed to provide an overview of neuroimaging in the assessment of adult primary brain tumors. We started from the basilar role of conventional/morphological MR sequences, then analyzed, one by one, the non-morphological techniques, and finally highlighted future perspectives, such as radiomics and artificial intelligence.

Keywords: AI; DTI; MR spectroscopy; MRI; advanced MR Imaging; brain tumor imaging; functional MRI; perfusion MRI; quantitative MRI.


Conflict of interest statement

The authors declare no conflict of interest.

Figures

Figure 13
Figure 13
Multiparametric MRI-based radiomic analysis. A multiparametric MRI-based radiomic analysis in steps: (1) medical imaging acquisition, (2) imaging segmentation, (3) feature extraction, (4) statistical analysis, and (5) results. The tumor ROI on all MR slices to extract the radiomic features. Features such as tumor shape, histogram, and texture features were extracted from the ROIs to discriminate the biological processes of GB habitats and facilitate personalized precision medicine [138].
Figure 14
Figure 14
Linking subregional imaging to molecular profiles in GB. In this example, tumor subregions (B) are defined by jointly clustering on contrast-enhanced T1WI and T2WI (A). These subregions correspond to red (high T1WI and high T2WI), yellow (high T1WI and low T2WI), blue (low T1WI and high T2WI), and pink (low T1WI and low T2WI) areas. The defined tumor subregions enable quantitative spatial characterization, offering a means to noninvasively assess specific molecular activities (C) with enriched molecular pathways (D) [139].
Figure 15
Figure 15
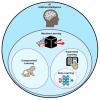
Graphical representation of AI methods. ML is a form of AI, divided into supervised and unsupervised learning. DL is a form of ML, usually based on supervised learning [160].
Figure 16
Figure 16
Graphical representation of the main applications of AI in BTs [156].
Figure 1
Figure 1
Morphological sequences: tumor cellularity. Morphological sequences: tumor cellularity. Left deep temporo-mesial WHO grade 3 IDH-mut diffuse astrocytoma. Lesion is hyperintense on T2w and FLAIR images (A,B), isointense on DWI (E), with areas of lower T2 signal intensity and diffusion restriction (white arrows in (A,D) that reflect hypercellular and probably more anaplastic tissue. No contrast enhancement is detectable on post-contrast T1w image (F) compared to pre-contrast image (C).
Figure 2
Figure 2
Conventional MR sequences: necrosis and hemorrhages. Right deep thalamo-capsular IDH-wt GB. The lesion shows a necrotic core (asterisk in (B,F)) and a thick and irregular rim of hypercellular tissue with restricted diffusion (C,D) and contrast-enhancement ((F) compared to (E)). (G,H) demonstrate hemosiderin marginal deposits (hypointense on both SWI and phase-map respectively) suggestive of intratumoral bleedings. The “rim enhancing” lesion is surrounded by a peripheral heterogeneous area of abnormal T2w/FLAIR signal (A,B), reflecting infiltrative “non enhancing” tumor and vasogenic edema that also involves the mesial surface of the contralateral thalamus and hypothalamus (arrow in (B). The caudal extension determines stenosis of the Sylvian aqueduct and consequently supratentorial hydrocephalus.
Figure 3
Figure 3
T2/FLAIR Mismatch Sign. Upper Row Ax T2w images, Lower Row Ax T2-FLAIR images. (A,E); (B,F) IDH-mut, 1p-19q codeleted ODs, respectively grade 2 (A,E) and grade 3 (B,F). (C,G); (D,H) IDH-mut, 1p-19q non codeleted Diffuse Astrocitomas, respectively grade 2 (C,G) and grade 3 (D,H). The T2-FLAIR mismatch sign (C) vs. (G) and (D) vs. (H) represents the T2 signal homogeneity of the mass with relatively hypointense signal throughout most of the lesion on FLAIR except for a peripheral rim of hyperintense signal. Notably, imaging features of grade 3 IDH-mut diffuse astrocytoma and OD may be indistinguishable from grade 2 IDH-mut diffuse astrocytoma and OD. However, grade 3 astrocytoma and OD may have more T2 signal heterogeneity (B,D).
Figure 4
Figure 4
DSC-PWI in differentiating HGG from LGG. Axial T2-FLAIR (A) and post-contrast T1w (B) of a low grade IDH-mut left insular astrocytoma. DSC-PWI demonstrates normal rCBV (C) and complete return to baseline of the signal-intensity-time curve (D). The second row shows axial T2-FLAIR (E) and post-contrast T1w (F) of a left temporal-occipital GB. DSC-PWI demonstrates increased rCBV (G) and reduction of PSR consistent with BBB breakdown (H).
Figure 5
Figure 5
Post-treatment changes vs. disease progression. (AH): axial 3D-FSPGR post-contrast T1w images (A,E) and T2w images (B,F) with corresponding DSC-CBV (C,D) and DCE-Ktrans perfusion maps (G,H) of two IDHwt GBs 1 year after treatment (surgery and radio-chemotherapy). In the left panel the enhancing tissue shows low DSC-CBV and DCE-Ktrans, consistent with post-treatment changes. In right panel the enhancing tissue shows areas of increased DSC-CBV and DCE-Ktrans, suggesting disease progression.
Figure 6
Figure 6
Diffusion Tensor Imaging: (A) normal FA map without any directional information; (B) Combined FA and directional map. Colors indicate directions as follows: red, left-right; green, anteroposterior; blue, superior-inferior. Brightness is proportional to FA; and (C) 3D visualization of normal corticospinal tracts.
Figure 7
Figure 7
Tractographic reconstruction of arcuate fasciculi. DTI of the direct pathway of both arcuate fasciculi (AF) fused with anatomic axial (A); and sagittal (B) FLAIR images. The right AF on the affected side is superiorly and posteriorly displaced by an IDH-mut frontal-temporal-insular astrocytoma; (C) 3D rendering of both arcuate fasciculi.
Figure 8
Figure 8
Example of normal spectrum (SV TE 144ms). Normal MR spectrum demonstrating Cho, Cr and NAA peaks.
Figure 9
Figure 9
MR Spectrum of LGG (SV TE 144ms). (A,B) Axial T2-FLAIR and post-contrast T1w of a left frontal low grade IDH-mut and 1p/19q-codeleted OD. (C) SV MRS demonstrates moderate Cho elevation and NAA reduction.
Figure 10
Figure 10
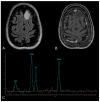
MR Spectrum of HGG (SV TE 144ms). (A,B) Axial T2-FLAIR and post-contrast T1w of a right parietal HGG, with necrotic areas; (C) SV MRS demonstrates a prominent increase in Cho and a decrease in NAA, with high Cho/Cr and low NAA/Cho ratios. Double negative peak of lactates is also present, consistent with the presence of necrosis.
Figure 11
Figure 11
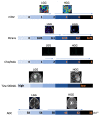
Schematic representation of the main MRI parameters used in the diagnostic work-up of gliomas on an arbitrary numerical scale, with indication of the main values associated with the degree of biological aggressiveness.
Figure 12
Figure 12
Language task-based fMRI. fMRI correlation maps of cortical activation during language tasks in a patient with frontal-temporal-insular GB. Blue represents areas of increased cortical activation. (A) 3D surface rendering with BOLD signal overlay reveals the activation of Broca’s Area, displaced posteriorly by the lesion (black arrow; expressive speech) and in the superior temporal gyrus (white arrow, Wernike’s Area, receptive speech); (B,C) Axial and coronal deskulled T1w-BRAVO with BOLD signal overlay confirm the activation and the dislocation of Broca’s Area and shows a significant but smaller activation in the right inferior frontal gyrus (white arrow’s head). Black arrow’s head indicates the supplementary Motor Area (C).
Figure 17
Figure 17
Example of T2 subtraction maps at different time points during follow-up. Upper row: T2 images at different time points. Lower row: T2 subtraction maps (with reference to time point one, not showed) at the same time points. T2 subtraction maps sharpen the evolution of T2 signal during time, hardly visible at the beginning on conventional T2 images (difference more evident at time point 9, red arrow) [168].

Similar articles

Cited by

References

    1. Sung H., Ferlay J., Siegel R.L., Laversanne M., Soerjomataram I., Jemal A., Bray F. Global Cancer Statistics 2020: GLOBOCAN Estimates of Incidence and Mortality Worldwide for 36 Cancers in 185 Countries. CA Cancer J. Clin. 2021;71:209–249. doi: 10.3322/caac.21660. - DOI - PubMed
    1. Mabray M.C., Barajas R.F., Jr., Cha S. Modern brain tumor imaging. Brain Tumor Res. Treat. 2015;3:8–23. doi: 10.14791/btrt.2015.3.1.8. - DOI - PMC - PubMed
    1. Haacke E.M., Mittal S., Wu Z., Neelavalli J., Cheng Y.C. Susceptibility-weighted imaging: Technical aspects and clinical applications, part 1. AJNR Am. J. Neuroradiol. 2009;30:19–30. doi: 10.3174/ajnr.A1400. - DOI - PMC - PubMed
    1. Gumprecht H.K., Widenka D.C., Lumenta C.B. BrainLab VectorVision Neuronavigation System: Technology and clinical experiences in 131 cases. Neurosurgery. 1999;44:97–104. doi: 10.1097/00006123-199901000-00056. - DOI - PubMed
    1. Zhang B., MacFadden D., Damyanovich A.Z., Rieker M., Stainsby J., Bernstein M., Jaffray D.A., Mikulis D., Ménard C. Development of a geometrically accurate imaging protocol at 3 Tesla MRI for stereotactic radiosurgery treatment planning. Phys. Med. Biol. 2010;55:6601–6615. doi: 10.1088/0031-9155/55/22/002. - DOI - PubMed

LinkOut - more resources