. 2023 Feb 4;11(2):459.
doi: 10.3390/biomedicines11020459.

Development of a TGFβ-IL-2/15 Switch Receptor for Use in Adoptive Cell Therapy

Affiliations

Development of a TGFβ-IL-2/15 Switch Receptor for Use in Adoptive Cell Therapy

Carole Beck et al. Biomedicines. .

Abstract

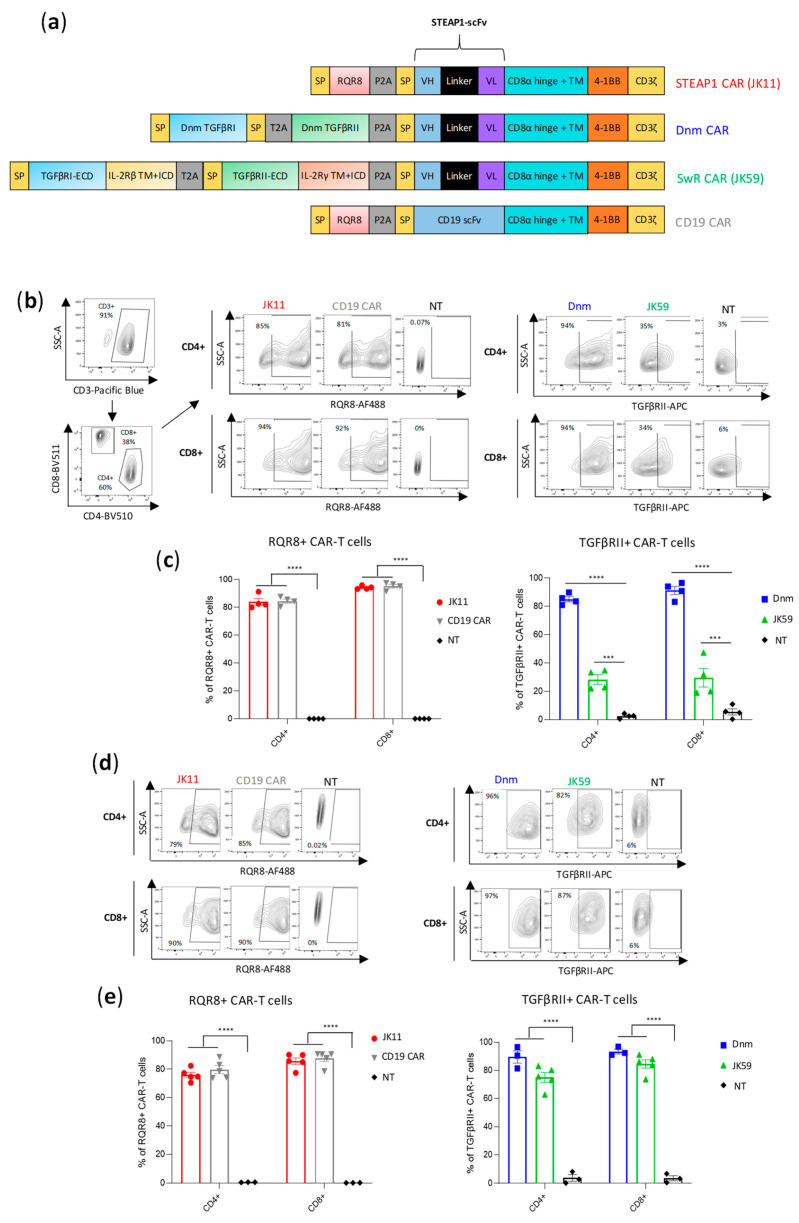
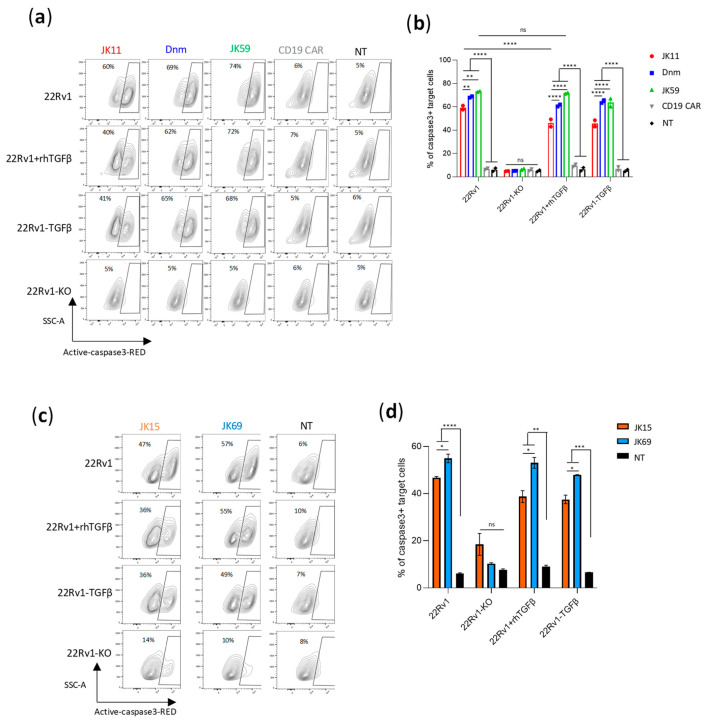
Therapy employing T cells modified with chimeric antigen receptors (CARs) is effective in hematological malignancies but not yet in solid cancers. CAR T cell activity in solid tumors is limited by immunosuppressive factors, including transforming growth factor β (TGFβ). Here, we describe the development of a switch receptor (SwR), in which the extracellular domains of the TGFβ receptor are fused to the intracellular domains from the IL-2/15 receptor. We evaluated the SwR in tandem with two variants of a CAR that we have developed against STEAP1, a protein highly expressed in prostate cancer. The SwR-CAR T cell activity was assessed against a panel of STEAP1+/- prostate cancer cell lines with or without over-expression of TGFβ, or with added TGFβ, by use of flow cytometry cytokine and killing assays, Luminex cytokine profiling, cell counts, and flow cytometry phenotyping. The results showed that the SwR-CAR constructs improved the functionality of CAR T cells in TGFβ-rich environments, as measured by T cell proliferation and survival, cytokine response, and cytotoxicity. In assays with four repeated target-cell stimulations, the SwR-CAR T cells developed an activated effector memory phenotype with retained STEAP1-specific activity. In conclusion, the SwR confers CAR T cells with potent and durable in vitro functionality in TGFβ-rich environments. The SwR may be used as an add-on construct for CAR T cells or other forms of adoptive cell therapy.

Keywords: chimeric antigen receptor; immune suppression; prostate cancer; switch receptor; transforming growth factor β; tumor microenvironment.


Conflict of interest statement

J.A. Kyte, N.P. Casey, C. Beck, and Y. Jin are inventors of patent applications related to the work described in this article.

Figures

Figure 1
Figure 1
CAR design and expression. (a) Schematic representations of the CAR constructs; parental STEAP1 CAR (JK11), control CD19 CAR, dominant negative mutant -STEAP1 CAR (Dnm) with the TGFβ receptor (TGFβR) lacking the intracellular signaling domain, TGFβ-switch receptor (SwR)-STEAP1 CAR (JK59) with the extracellular domain (ECD) of the TGFβRI and TGFβRII subunits fused to the transmembrane domain (TM) and intracellular domain (ICD) of the IL-2/IL-15 receptor β and γ chains, respectively (IL-2Rβ and IL-2Rγ). (b) Flow analysis of CAR expression in primary human T cells stained with CD3, CD4, and CD8 (left panel), and with the antibody recognizing the RQR8 sequence of JK11 and CD19 control CAR (middle panel) or the TGFβRII antibody recognizing Dnm and JK59 CARs (right panel). T cells were stained five days after viral transduction. (c) Graphs representing the expression of JK11 and CD19 CARs (right panel) and Dnm and JK59 CARs (left panel). Data represent the mean values ± SEM of 4 different T cell transductions from 4 different healthy donors (each transduction was performed in duplicate). (d) Flow analysis of the CAR expression in human T cells after CAR T cells freezing/thawing and two days activation with anti-CD3/CD28 antibodies. Contour plots of JK11 and CD19 CAR (left panel) and of Dnm and JK59 CAR expression (right panel). (e) Graphs representing the expression of JK11 and CD19 CARs (left panel) and Dnm and JK59 CARs (right panel) after freeze-thawing and activation for two days, from three to five healthy donors. Data represent the mean values ± SEM. Data were analyzed by one-way ANOVA with Tukey’s multiple comparisons test. *** p < 0.001; **** p < 0.0001.
Figure 2
Figure 2
Dnm and SwR-STEAP1 CAR T cells induce the production of IFNγ and TNFα and apoptosis upon co-culture with STEAP1+ target cells in vitro. (a) Graphs of the CAR expression (measured five days after transduction) of freshly transduced JK11, Dnm, JK59, and CD19 CAR T cells and non-transduced (NT) T cells. The CAR expression of JK11 and CD19 CAR T cells (left panel) was detected with the antibody recognizing the RQR8 sequence, and the CAR expression of Dnm and JK59 CAR T cells (right panel) was detected with the TGFβRII antibody (as shown in Figure 1). Data represent mean values ± SEM of three different healthy donors, each in triplicate. Data were analyzed by two-way ANOVA with Tukey’s multiple comparisons test. ** p < 0.01; *** p < 0.001; **** p < 0.0001. (b,c) CAR T cells and non-transduced (NT) cells were co-cultured (in duplicate) with 22Rv1, 22Rv1-KO, and NALM-6 target cells at an E:T ratio of 1:3 for 18 h. Production of TNFα and IFNγ was measured with flow cytometry by gating on CD3+, and CD4+, or CD8+ cells (gating strategy in Figure S4a–c). (b) Percentage of TNFα production in CD4+ (left panel) and CD8+ (right panel) T cells. (c) Percentage of IFNγ production in CD4+ (left panel) and CD8+ (right panel) T cells. CAR T cells cultured alone (CD4+ and CD8+ cells only) were included as controls to indicate the baseline of TNFα (in (b)) and of IFNγ (in (c)). Data represent mean values ± SEM of three different healthy donors, each in duplicate. Graphs are representative of two independent experiments. Data were analyzed by one-way ANOVA with Tukey’s multiple comparisons test. * p < 0.05; *** p < 0.001; **** p < 0.0001; ns = not significant. (d) Representative contour plots of 22Rv1, 22Rv1-KO, and NALM-6 target cells co-cultured with freshly transduced CAR T cells or non-transduced (NT) cells, at an E:T ratio of 3:1 for 24 h. Lysis of target cells was measured by the intensity of FITC-active-caspase3 using flow cytometry (gating strategy in Figure S4d). (e) Graphs representing the percentage of apoptotic cells among 22Rv1 (left panel), 22Rv1-KO (middle panel), and NALM-6 (right panel) cells co-cultured with the different CAR T cell groups, or the NT control group at E:T ratios 1:3, 1:1, 3:1, and 5:1 for 24 h. Target cells cultured alone (tumor cells only) were included as controls to indicate the baseline of active caspase3. Data represent mean values ± SEM of two different healthy donors, each in duplicate. Graphs are representative of two independent experiments. Data were analyzed by two-way ANOVA with Tukey’s multiple comparisons test. ** p < 0.01; **** p < 0.0001; ns = not significant.
Figure 3
Figure 3
SwR-STEAP1 CAR T cells have superior cytotoxic activity in a TGFβ-rich environment. (a) Representative contour plots of 22Rv1, 22Rv1-KO, and 22Rv1-TGFβ target cell lines, and 22Rv1 target cells in the presence of 10 ng/mL rhTGFβ, co-cultured with freeze-thawed and non-activated JK11, Dnm, JK59, and CD19 CAR T cells, or NT T cells, at an E:T ratio of 1:1 for 48 h. Lysis of target cells was measured by the intensity of Red-active-caspase3, using flow cytometry. (b) A graph representing the percentage of apoptotic cells among 22Rv1, 22Rv1-KO, and 22Rv1-TGFβ cell lines and 22Rv1 cells cultured in the presence of 10 ng/mL rhTGFβ. Data represent the mean values ± SEM of two healthy donors from one representative experiment, in which each co-culture was performed in duplicate. The experiment was repeated two times. Data were analyzed by two-way ANOVA with Tukey’s multiple comparisons test. ** p < 0.01; **** p < 0.0001; ns = not significant. (c) Representative contour plots of 22Rv1, 22Rv1-KO, 22Rv1-TGFβ target cell lines, and 22Rv1 target cells in the presence of 10 ng/mL rhTGFβ, co-cultured with frozen/thawed and non-activated JK15 and JK69 CAR T cells, or non-transduced (NT) T cells, at an E:T ratio of 1:1 for 48 h. Lysis of target cells was measured by the intensity of Red-active-caspase3 staining/labeling by flow cytometry (gating strategy in Figure S4d). (d) A graph representing the percentage of apoptotic cells among 22Rv1, 22Rv1-KO, 22Rv1-TGFβ cell lines, and 22Rv1 cells cultured in the presence of 10 ng/mL rhTGFβ. Data represent the mean values ± SEM of one healthy donor (in duplicates) from one representative experiment. The experiment was repeated two times. Data were analyzed by one-way ANOVA with Tukey’s multiple comparisons test. * p < 0.05; ** p < 0.01; *** p < 0.001; **** p < 0.0001; ns = not significant.
Figure 4
Figure 4
TGFβ induces proliferation of the SwR-STEAP1 CAR T cells. (a) Graphs representing the CAR expression (measured six days after transduction) of freshly transduced JK11, Dnm, JK59, and CD19 CAR T cells and non-transduced (NT) T cells. The CAR expression of JK11 and CD19 CAR T cells was detected with the antibody recognizing the RQR8 sequence (left panel), and the CAR expression of Dnm and JK59 CAR T cells was detected with the TGFβRII antibody (right panel) (as shown in Figure 1). not det.: not detected (b) Graphs representing the CAR expression (measured six days after transduction) of freshly transduced JK15 and JK69 CAR T cells. The CAR expression was detected with the antibody recognizing the IgGh1 hinge of JK15 and JK69 CARs (right panel) (as shown in Figure S2). The CAR expression was also detected with the antibody recognizing the RQR8 sequence (left panel) and with the TGFβRII antibody (middle panel) in the JK15 and JK69 CAR T cells, respectively. not det: not detected. (c,e) The freshly transduced CAR T cells, and non-transduced (NT) T cells, were cultured for 21 days in the presence of 15 ng/mL recombinant human TGFβ (rhTGFβ). The absolute number of T cells was measured every 7 days (from day of transduction, day 0) with flow cytometry using counting beads. In (c), CD19 and NT lines follow the JK11 line and are, therefore, not visible. (d,f) The number of JK59 and JK69 CAR T cells measured every 7 days with flow cytometry using counting beads, after incubation with different concentrations of rhTGFβ, until day 21. Data represent the mean values ± SEM of one healthy donor (in duplicates) from one representative experiment. The experiment was repeated two times. Data were analyzed by one-way ANOVA with Tukey’s multiple comparisons test. * p < 0.05; ** p < 0.01; *** p < 0.001; **** p < 0.0001; ns = not significant. (g) At the end of the proliferation assay (day 21), JK59 (left panel) and JK69 (right panel) CAR T cells cultured with 10 ng/mL and 15 ng/mL rhTGFβ were co-cultured with 22Rv1, 22Rv1-KO, 22Rv1-TGFβ cell lines and 22Rv1 cells cultured in the presence of 10 ng/mL rhTGFβ (22Rv1 + rhTGFβ) at an E:T ratio 1:1 for 48 h. Lysis of target cells was measured by the intensity of Red-active-caspase3, using flow cytometry (gating strategy in Figure S4d). The percentage of apoptotic target cells is represented in the graphs. Data represent the mean values ± SEM of one healthy donor (in duplicates) from one experiment.
Figure 5
Figure 5
TGFβ enhances the proliferation and functionality of SwR-STEAP1 CAR T cells after repeated in vitro stimulation with tumor cells. Freeze-thawed and activated JK11, JK59, and CD19 CAR T cells, and non-transduced (NT) control T cells, were co-cultured with irradiated (20 Gy) 22Rv1 and 22Rv1-KO target cells in the absence or presence of 10 ng/mL rhTGFβ at an E:T ratio of 1:1 for 3 to 4 days. Every 3 to 4 days, the T cell number was measured, and the same T cells were co-cultured again on freshly irradiated target cells for 3 to 4 more days until day 13. (a) Graphs representing the CAR expression of JK11, JK59, and CD19 CAR T cells and non-transduced (NT) T cells following co-culture with 22Rv1 target cells at days 0, 6, and 13. (b) Graphs representing the CAR expression of JK11, JK59, and CD19 CAR T cells and non-transduced (NT) T cells following co-culture with 22Rv1-KO target cells at days 0, 6, and 13. In (a,b), the CAR expression of JK11 and CD19 CAR T cells was detected with the antibody recognizing the RQR8 sequence (left panels), and the CAR expression of JK59 CAR T cells was detected with the TGFβRII antibody (right panels) (c) A graph representing the number of T cells following co-culture with 22Rv1 (left panel) or 22Rv1-KO (right panel) target cells at days 0, 3, 6, 10, and 13. (d) A graph representing the number of T cells after co-culture with 22Rv1 (left panel) or 22Rv1-KO (right panel) target cells at days 0, 3, 6, 10, and 13 in the presence of 10 ng/mL rhTGFβ. Data in (c,d) represent the mean values ± SEM of two healthy donors. Each co-culture with each donor’s cells was performed in duplicate, and each duplicate pair was kept separate until the end of the experiment. Data were determined by two-way ANOVA with Tukey’s multiple comparisons test. ** p < 0.01; *** p < 0.001; **** p < 0.0001; ns = not significant. (e) Before the start of the long-term co-culture (day 0), JK11, JK59, and CD19 CAR T cells and NT T cells were co-cultured with 22Rv1 and 22Rv1-KO target cells, and with 22Rv1 in the presence of 10 ng/mL rhTGFβ at an E:T ratio of 1:1 for 24 h. (f) At the end of the long-term co-culture (day 13), JK11, JK59 CAR T cells, and JK59 CAR T cells cultured with 10 ng/mL rhTGFβ, each co-cultured with 22Rv1 target cells for 13 days, were co-cultured with 22Rv1 and 22Rv1-KO cells at an E:T ratio 1:1 for 24 h. In (e,f), lysis of target cells was measured by the intensity of Red-active-caspase3, using flow cytometry, as represented by the contour plots (top panels) (gating strategy in Figure S4d). The percentage of apoptotic target cells is represented in the graphs (lower panels). Target cells cultured alone (tumor cells only) were included as controls to indicate the baseline of active caspase3. Data represent the mean values ± SEM of two healthy donors. Each co-culture from each donor was performed in duplicate, and each duplicate pair was kept separate until the end of the experiment. In (e,f), statistical significances were determined by one-way ANOVA with Tukey’s multiple comparisons test. * p < 0.05; ** p < 0.01; **** p < 0.0001; ns = not significant.
Figure 6
Figure 6
TGFβ maintains a high cytokine profile in SwR-STEAP1 CAR T cells after repeated in vitro stimulation of STEAP1+ tumor cells. Luminex cytokine analyses were performed using T cells supernatants isolated at days 3, 6, and 13 from JK11 and JK59 CAR T cells and non-transduced (NT) T cells co-cultured with 22Rv1 target cells in the absence or presence of 10 ng/mL rhTGFβ (as shown in Figure 5). Data represent the mean values ± SEM from two healthy donors. Each co-culture from each donor was performed in duplicate, and each duplicate pair was kept separate throughout the experiment. The “#” symbol indicates that the values are higher than 16,000 pg/mL.
Figure 7
Figure 7
Analysis of STEAP1 and SwR-STEAP1 CAR T cell phenotyping after repeated in vitro stimulation of STEAP1+ tumor cells. Long-term co-culture was achieved by stimulating every 3 to 4 days the JK11, JK59, and CD19 CAR T cells and NT T cells, with irradiated 22Rv1 and 22Rv1-KO target cells at an E:T ratio of 1:1 in the absence or presence of 10 ng/mL rhTGFβ. Before the start of the co-culture (day 0), at day 6, and day 13, CAR T cell phenotyping was assessed with flow cytometry. (a,b) The CD4+ and CD8+ T cell populations co-cultured with 22Rv1 target cells (a) or with 22Rv1-KO target cells (b) were assessed for surface expression of the activation marker CD25 and the checkpoint receptors PD1, LAG3, TIM3, and TIGIT. Background staining for each marker was identified using Fluorescence Minus One controls (see Figure S7a–c for gating strategy). Data represent the mean values ± SEM from two healthy donors. Each co-culture was performed in duplicate, and these were kept separate throughout the assay.
Figure 8
Figure 8
SwR-STEAP1 CAR T cells show a higher polyfunctionality after repeated in vitro stimulation of tumor cells. ‘Parts of Whole’ graphs showing the co-expression of the activation maker CD25 with the checkpoint receptors PD1, LAG3, TIM3, and TIGIT on CD4+ (a) and CD8+ (b) JK11 and JK59 CAR T cells. Samples were collected before the start of long-term co-culture assay (day 0) and at days 6 and 13 of co-culture. T cells were co-cultured with 22Rv1 cells or with 22Rv1 target cells in the presence of rhTGFβ (22Rv1 + rhTGFβ). Co-cultures were performed at an E:T ratio of 1:1 (see also Figure 7 and Figure S8). Average expression values from the two healthy donors of the long-term co-culture assay were used. Each co-culture from each donor was performed in duplicate.

Similar articles

Cited by

References

    1. Grupp S.A., Kalos M., Barrett D., Aplenc R., Porter D.L., Rheingold S.R., Teachey D.T., Chew A., Hauck B., Wright J.F., et al. Chimeric antigen receptor-modified T cells for acute lymphoid leukemia. N. Engl. J. Med. 2013;368:1509–1518. doi: 10.1056/NEJMoa1215134. - DOI - PMC - PubMed
    1. Weber E.W., Maus M.V., Mackall C.L. The Emerging Landscape of Immune Cell Therapies. Cell. 2020;181:46–62. doi: 10.1016/j.cell.2020.03.001. - DOI - PMC - PubMed
    1. Abken H. Adoptive therapy with CAR redirected T cells: The challenges in targeting solid tumors. Immunotherapy. 2015;7:535–544. doi: 10.2217/imt.15.15. - DOI - PubMed
    1. Kyte J.A. Strategies for Improving the Efficacy of CAR T Cells in Solid Cancers. Cancers. 2022;14:571. doi: 10.3390/cancers14030571. - DOI - PMC - PubMed
    1. Martin C.J., Datta A., Littlefield C., Kalra A., Chapron C., Wawersik S., Dagbay K.B., Brueckner C.T., Nikiforov A., Danehy F.T., Jr., et al. Selective inhibition of TGFbeta1 activation overcomes primary resistance to checkpoint blockade therapy by altering tumor immune landscape. Sci. Transl. Med. 2020;12:eaay8456. doi: 10.1126/scitranslmed.aay8456. - DOI - PubMed

LinkOut - more resources