. 2023 Feb 18;11(2):616.
doi: 10.3390/biomedicines11020616.

Oral Administration of Vitamin D3 Prevents Corneal Damage in a Knock-Out Mouse Model of Sjögren's Syndrome

Affiliations

Oral Administration of Vitamin D3 Prevents Corneal Damage in a Knock-Out Mouse Model of Sjögren's Syndrome

Maria Consiglia Trotta et al. Biomedicines. .

Abstract

Background: Vitamin D deficiency has been associated with dry eye development during Sjögren's syndrome (SS). Here, we investigated whether repeated oral vitamin D3 supplementation could prevent the corneal epithelium damage in an SS mouse model.

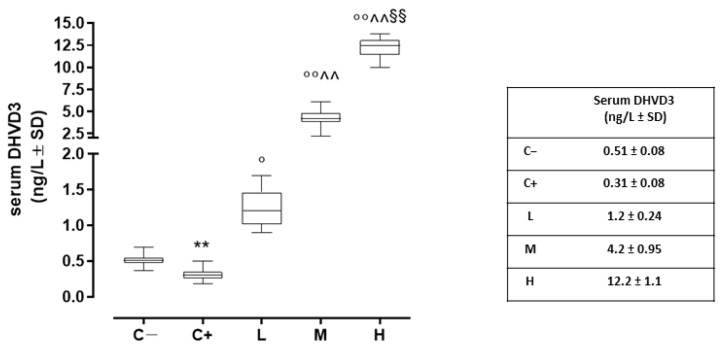
Methods: 30 female mouse knock-out for the thrombospondin 1 gene were randomized (six per group) in untreated mice euthanized at 6 weeks as negative control (C-) or at 12 weeks as the positive control for dry eye (C+). Other mice were sacrificed after 6 weeks of oral vitamin D3 supplementation in the drinking water (1000, 8000, and 20,000 IU/kg/week, respectively).

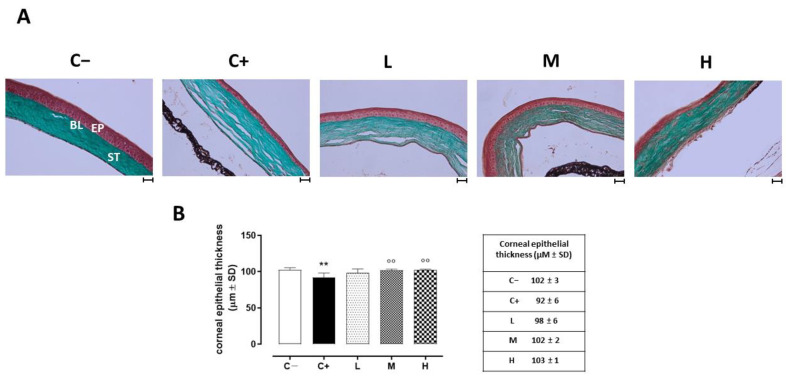
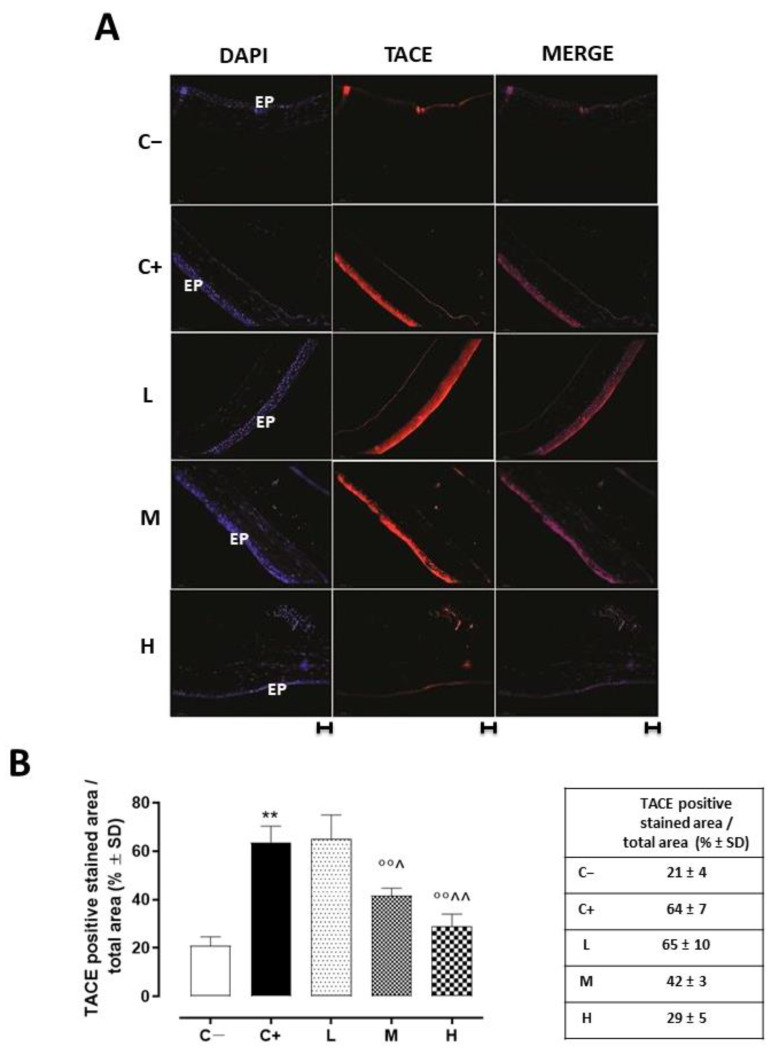
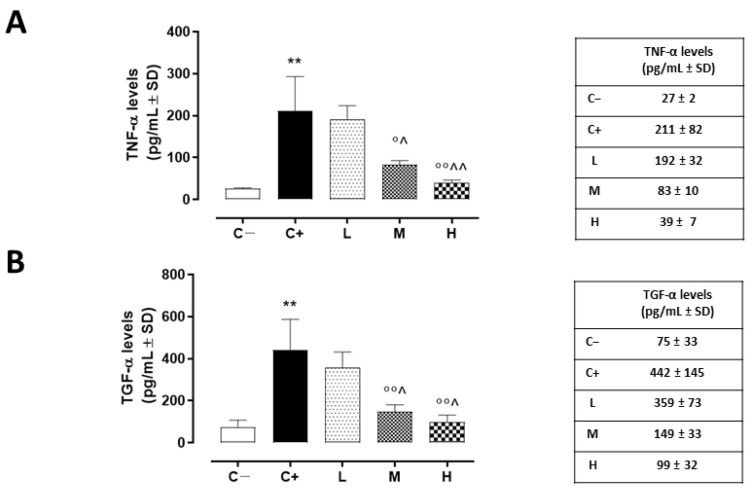
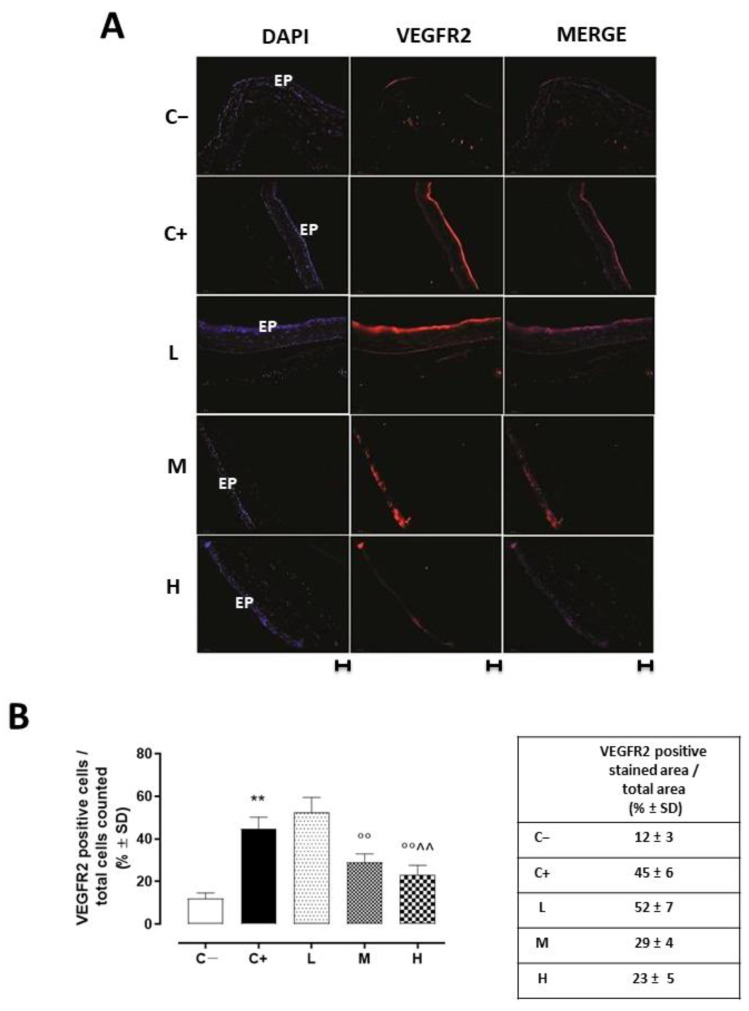
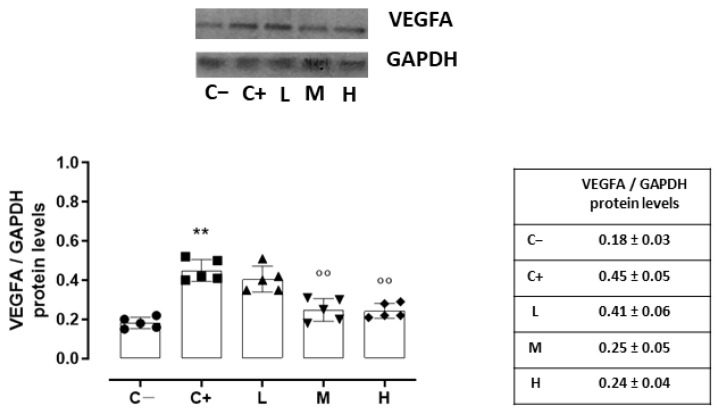
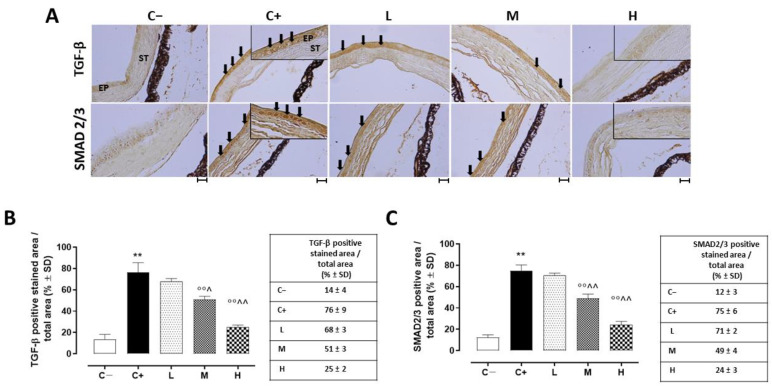
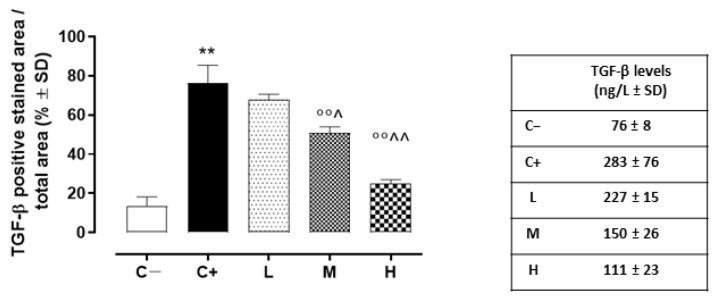
Results: The C+ mice showed alterations in their corneal epithelial morphologies and thicknesses (p < 0.01 vs. C-), while the mice receiving 8000 (M) and 20,000 (H) IU/kg/week of vitamin D3 showed preservation of the corneal epithelium morphology and thickness (p < 0.01 vs. C+). Moreover, while the C+ mice exhibited high levels and activity of corneal tumor necrosis factor alpha converting enzyme (TACE), neovascularization and fibrosis markers; these were all reduced in the M and H mice.

Conclusions: Oral vitamin D3 supplementation appeared to counteract the negative effect of TACE on corneal epithelium in a mouse model of SS-associated dry eye.

Keywords: Sjögren’s syndrome; cornea; dry eye; thrombospondin-1 knock-out mice; tumor necrosis factor alpha converting enzyme; vitamin D.


Conflict of interest statement

The authors declare no conflict of interest.

Figures

Figure 1
Figure 1
Serum DHVD3 levels (ng/L) in the TSP-1 KO mice euthanized at 6 weeks of age as a negative control for SS-associated dry eye (C; TSP-1 KO mice euthanized at 12 weeks of age as a positive control for SS-associated dry eye (C+); and TSP-1 KO mice supplied with a low (L), medium (M), and high (H) dose of vitamin D3 (1000, 8000, and 20,000 IU/kg/week, respectively) from week 6 to week 12 of age. N = 6 mice per group. ** p < 0.01 vs. C−; ° p < 0.05 and °° p < 0.01 vs. C+; ^^ p < 0.01 vs. L; §§ p < 0.01 vs. M.
Figure 2
Figure 2
(A) Corneal GT staining in the TSP-1 KO mice euthanized at 6 weeks of age as a negative control for SS-associated dry eye (C−); TSP-1 KO mice euthanized at 12 weeks of age as a positive control for SS-associated dry eye (C+); and TSP-1 KO mice supplied with low (L), medium (M), and high (H) doses of vitamin D3 (1000, 8000, and 20,000 IU/kg/week, respectively) from week 6 to week 12 of age. EP: corneal epithelium; BL: Bowman’s layer; ST: stroma. Scale bar: 20 µm; magnification 40×. (B) Central corneal epithelial thickness (µm ± SD) in the same experimental groups. N = 7 corneas per group. ** p < 0.01 vs. C−; °° p < 0.01 vs. C+.
Figure 3
Figure 3
(A) Representative immunofluorescence images of TACE staining (red) and (B) relative quantization, expressed as percentages of TACE positive cells (red)/total cells counted (blue) in the TSP-1 KO mice euthanized at 6 weeks of age as a negative control for SS-associated dry eye (C−); TSP-1 KO mice euthanized at 12 weeks of age as a positive control for SS-associated dry eye (C+); and TSP-1 KO mice supplied with low (L), medium (M), and high (H) doses of vitamin D3 (1000, 8000, and 20,000 IU/kg/week, respectively) from week 6 to week 12 of age. N = 7 corneas per group; EP: corneal epithelium; scale bar 20 µm; magnification 40×. ** p < 0.01 vs. C−; °° p < 0.01 vs. C+; ^ p < 0.05 and ^^ p < 0.01 vs. L.
Figure 4
Figure 4
(A) Corneal TNF-α (pg/mL ± SD) and (B) TGF-α (pg/mL ± SD) levels in the TSP-1 KO mice euthanized at 6 weeks of age as a negative control for SS-associated dry eye (C−); TSP-1 KO mice euthanized at 12 weeks of age as a positive control for SS-associated dry eye (C+); and TSP-1 KO mice supplied with low (L), medium (M), and high (H) doses of vitamin D3 (1000, 8000, and 20,000 IU/kg/week, respectively), from week 6 to week 12 of age. N = 5 corneas per group. ** p < 0.01 vs. C−; ° p < 0.05 and °° p < 0.01 vs. C+; ^ p < 0.05 and ^^ p < 0.01 vs. L.
Figure 5
Figure 5
(A) Representative immunofluorescence images of the VEGFR2 staining (red) and (B) relative quantization, expressed as percentage of the VEGFR2 positive stained area (red)/total cells counted (blue) in the TSP-1 KO mice euthanized at 6 weeks of age as a negative control for SS-associated dry eye (C−); TSP-1 KO mice euthanized at 12 weeks of age as a positive control for SS-associated dry eye (C+); and TSP-1 KO mice supplied with low (L), medium (M), and high (H) doses of vitamin D3 (1000, 8000, and 20,000 IU/kg/week, respectively) from week 6 to week 12 of age. N = 7 corneas per group; EP: corneal epithelium. Scale bar: 20 µm; magnification 40×. ** p < 0.01 vs. C−; °° p < 0.01 vs. C+; ^^ p < 0.01 vs. L.
Figure 6
Figure 6
Representative Western blot images for corneal VEGFA and GAPDH, with relative quantization (both VEGFA and GAPDH values were detected as densitometric units ± SD) in the TSP-1 KO mice euthanized at 6 weeks of age as a negative control for SS-associated dry eye (C−); TSP-1 KO mice euthanized at 12 weeks of age as a positive control for SS-associated dry eye (C+); and TSP-1 KO mice supplied with low (L), medium (M), and high (H) doses of vitamin D3 (1000, 8000, and 20,000 IU/kg/week, respectively) from week 6 to week 12 of age. N = 7 corneas per group; EP: corneal epithelium. N = 5 corneas per group. ** p < 0.01 vs. C−; °° p < 0.01 vs. C+.
Figure 7
Figure 7
(A) Representative immunohistochemistry images of corneal TGF-β and SMAD2/3 and the relative quantization of TGF-β (B) and SMAD2/3 (C) staining (black arrows), expressed as percentages ± SDs of the positive stained area/total area in the TSP-1 KO mice euthanized at 6 weeks of age as a negative control for SS-associated dry eye (C−); TSP-1 KO mice euthanized at 12 weeks of age as a positive control for SS-associated dry eye (C+); and TSP-1 KO mice supplied with low (L), medium (M), and high (H) doses of vitamin D3 (1000, 8000, and 20,000 IU/kg/week, respectively) from week 6 to week 12 of age. N = 7 corneas per group; EP: corneal epithelium; ST: stroma. Scale bar 20 µm; magnification 40×. ** p < 0.01 vs. C−; °° p < 0.01 vs. C+; ^ p < 0.05 and ^^ p < 0.01 vs. L.
Figure 8
Figure 8
Corneal TGF-β levels (ng/L ± SD) in the TSP-1 KO mice euthanized at 6 weeks of age as a negative control for SS-associated dry eye (C−); TSP-1 KO mice euthanized at 12 weeks of age as a positive control for SS-associated dry eye (C+); and TSP-1 KO mice supplied with low (L), medium (M), and high (H) doses of vitamin D3 (1000, 8000, and 20,000 IU/kg/week, respectively) from week 6 to week 12 of age. N = 5 corneas per group. ** p < 0.01 vs. C−; °° p < 0.01 vs. C+; ^ p < 0.05 and ^^ p < 0.01 vs. L.

Similar articles

Cited by

References

    1. Gao Y., Chen Y., Zhang Z., Yu X., Zheng J. Recent Advances in Mouse Models of Sjögren’s Syndrome. Front. Immunol. 2020;11:1158. doi: 10.3389/fimmu.2020.01158. - DOI - PMC - PubMed
    1. Rowe D., Griffiths M., Stewart J., Novick D., Beverley P.C., Isenberg D.A. HLA Class I and II, Interferon, Interleukin 2, and the Interleukin 2 Receptor Expression on Labial Biopsy Specimens from Patients with Sjogren’s Syndrome. Ann. Rheum. Dis. 1987;46:580–586. doi: 10.1136/ard.46.8.580. - DOI - PMC - PubMed
    1. Vakaloglou K.M., Mavragani C.P. Activation of the Type I Interferon Pathway in Primary Sjögren’s Syndrome: An Update. Curr. Opin. Rheumatol. 2011;23:459–464. doi: 10.1097/BOR.0b013e328349fd30. - DOI - PubMed
    1. Mavragani C.P., Moutsopoulos H.M. Sjögren’s Syndrome. Annu. Rev. Pathol. Mech. Dis. 2014;9:273–285. doi: 10.1146/annurev-pathol-012513-104728. - DOI - PubMed
    1. Tucci M., Quatraro C., Silvestris F. Sjögren’s Syndrome: An Autoimmune Disorder with Otolaryngological Involvement. ACTA Otorhinolaryngol. Ital. 2005;25:139–144. - PMC - PubMed

LinkOut - more resources