. 2023 Feb 6;12(4):528.
doi: 10.3390/cells12040528.

Up-Regulation of Astrocytic Fgfr4 Expression in Adult Mice after Spinal Cord Injury

Affiliations

Up-Regulation of Astrocytic Fgfr4 Expression in Adult Mice after Spinal Cord Injury

Claire Mathilde Bringuier et al. Cells. .

Abstract

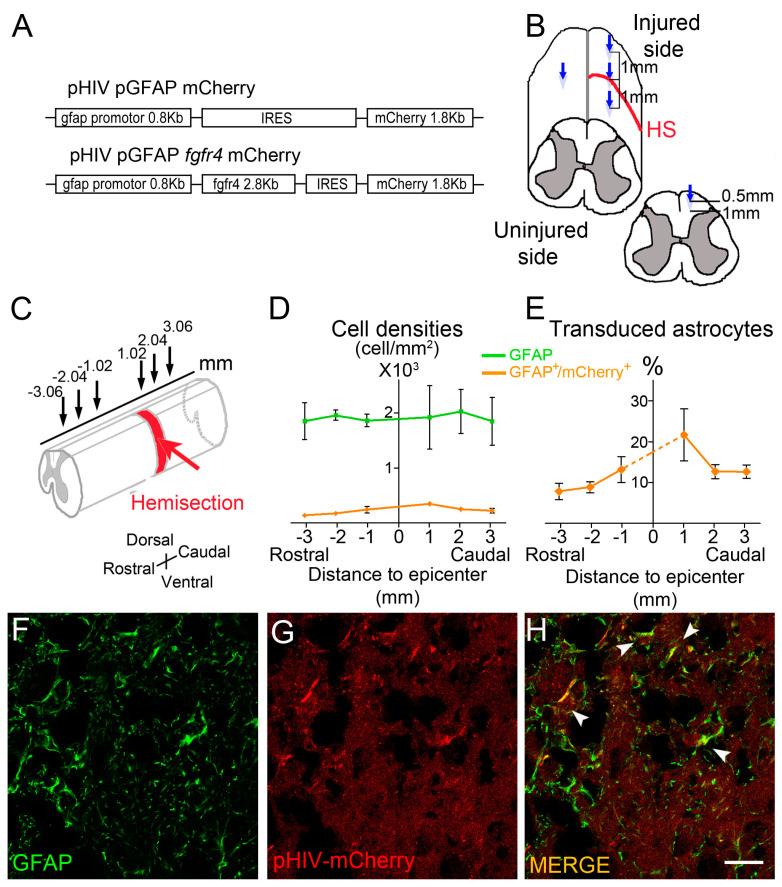
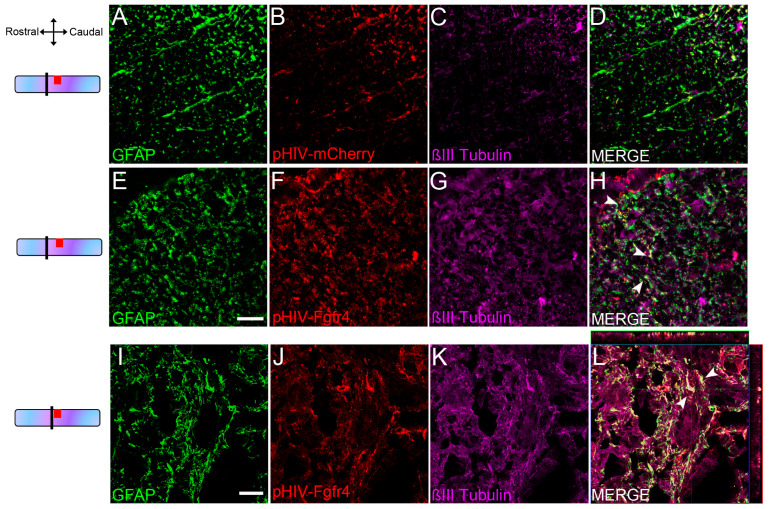
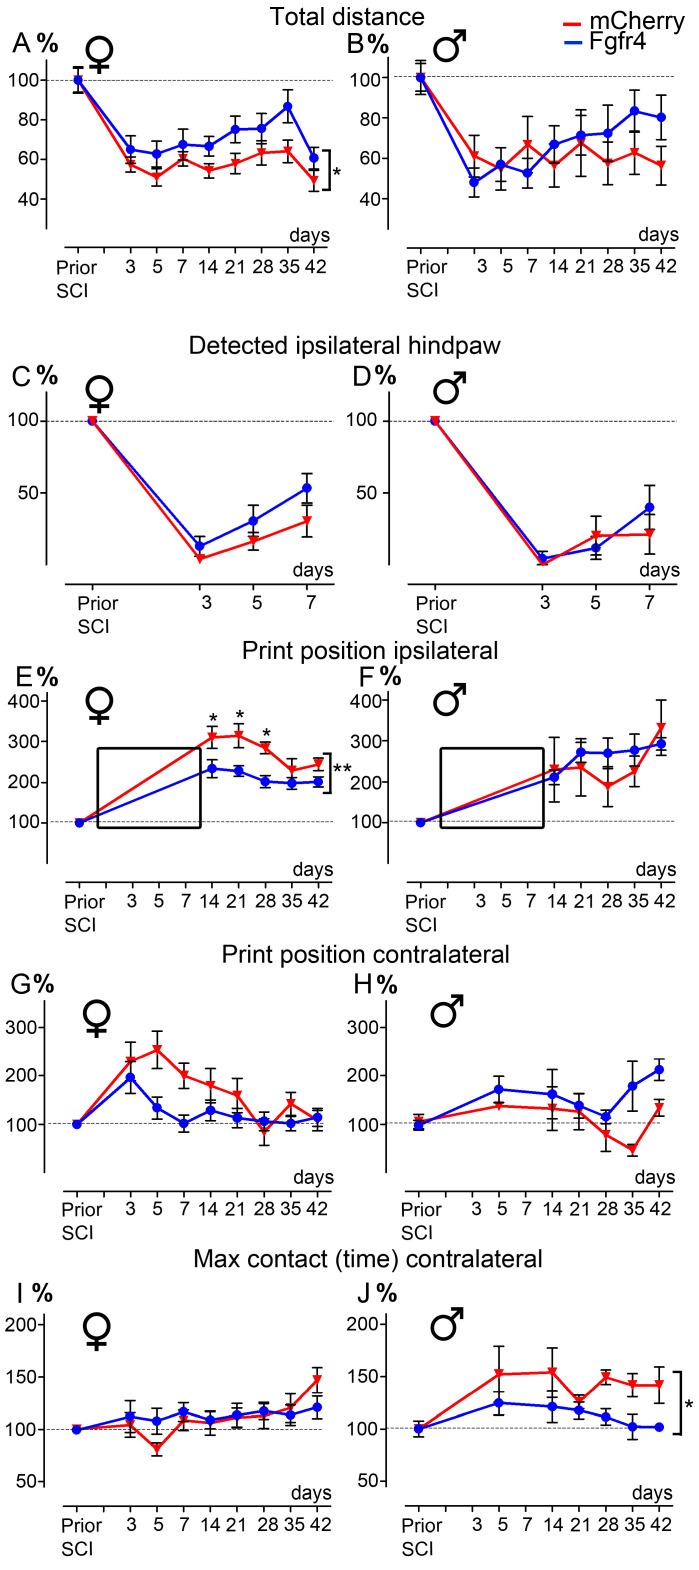
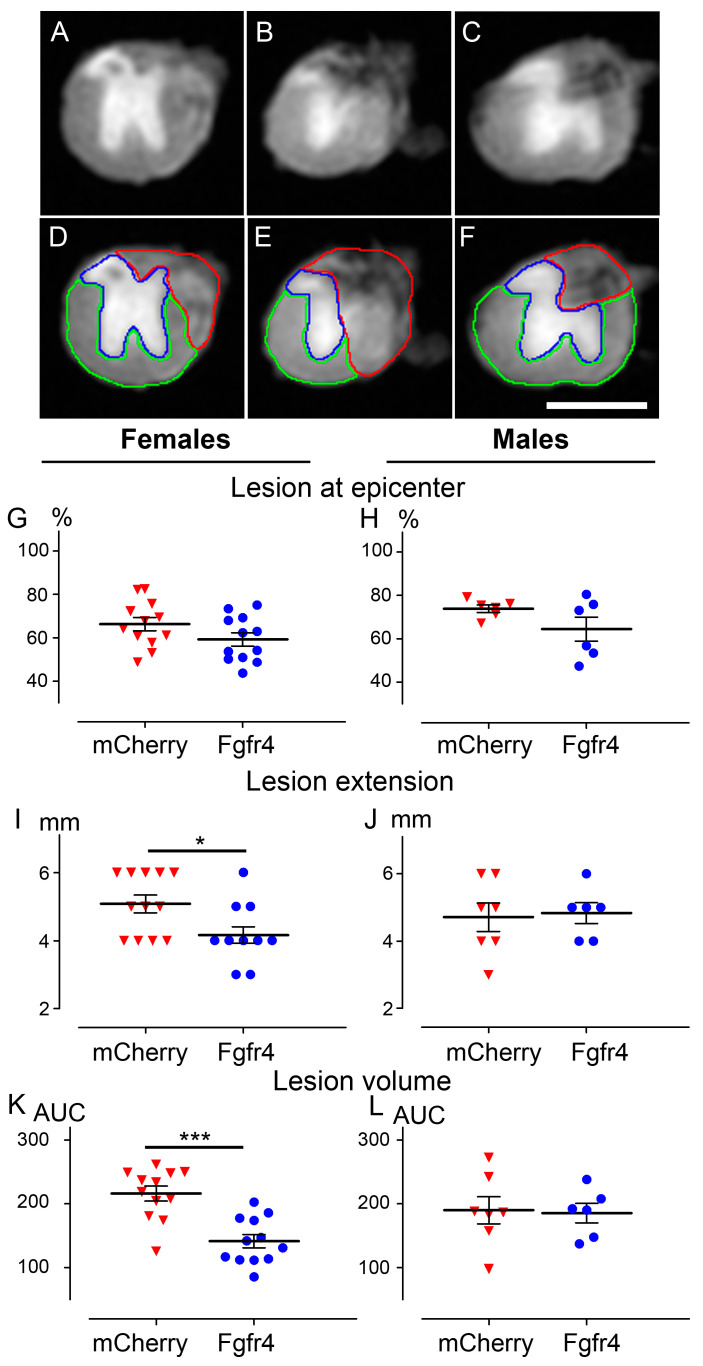
Spinal cord injury (SCI) leads to persistent neurological deficits without available curative treatment. After SCI astrocytes within the lesion vicinity become reactive, these undergo major morphological, and molecular transformations. Previously, we reported that following SCI, over 10% of resident astrocytes surrounding the lesion spontaneously transdifferentiate towards a neuronal phenotype. Moreover, this conversion is associated with an increased expression of fibroblast growth factor receptor 4 (Fgfr4), a neural stem cell marker, in astrocytes. Here, we evaluate the therapeutic potential of gene therapy upon Fgfr4 over-expression in mature astrocytes following SCI in adult mice. We found that Fgfr4 over-expression in astrocytes immediately after SCI improves motor function recovery; however, it may display sexual dimorphism. Improved functional recovery is associated with a decrease in spinal cord lesion volume and reduced glial reactivity. Cell-specific transcriptomic profiling revealed concomitant downregulation of Notch signaling, and up-regulation of neurogenic pathways in converting astrocytes. Our findings suggest that gene therapy targeting Fgfr4 over-expression in astrocytes after injury is a feasible therapeutic approach to improve recovery following traumatism of the spinal cord. Moreover, we stress that a sex-dependent response to astrocytic modulation should be considered for the development of effective translational strategies in other neurological disorders.

Keywords: Fgfr4; astrocytes; gene therapy; spinal cord injury; transdifferentiation.


Conflict of interest statement

The authors declare no conflict of interest.

Figures

Figure 1
Figure 1
In vivo transduction of astrocytes after SCI: Schematic view of the vector constructs (A). Immediately following T9 lateral hemisection of the mouse spinal cord, 1 µL of vectors (pHIV-Fgfr4 or pHIV-mCherry) was injected into four distinct locations: within the lesion site, contralateral to the lesion site, 1 mm rostral, and 1 mm caudal to the lesion site. Each injection location consisted of two depths (0.5 and 1 mm depth in the dorsoventral axis) (B). To assess lentiviral vector diffusion and astrocytic transduction efficiency, immunohistochemistry analyses were performed 2 weeks after SCI (pHIV-mCherry-injected animals) in three distinct locations both rostral and caudal to the lesion (±1020 µm, ±2040 µm, and ±3060 µm, respectively) (C). Quantification of the density of GFAP+ cells (astrocytes) and mCherry+/GFAP+ cells (transduced astrocytes) (D). Percentage of transduced astrocytes (mCherry+/GFAP+ cells) relative to total GFAP+ population (E). Confocal images taken in close vicinity of the lesion 6 weeks after SCI (FH). Transduced astrocytes persist at chronic stages (arrowheads, (H)). Three mouse spinal cord were quantified. Data are expressed as mean ± SEM. Scale bar: 20 µm.
Figure 2
Figure 2
Transduced astrocytes express βIII-tubulin 6 weeks after SCI. Schemes on the left indicate the location of images. Representative THUNDER images of pHIV-mCherry-injected female mice (dorsal white matter) 2 mm rostral to the lesion at 6 weeks after SCI. Displayed images represent maximum intensity projection of a z stack of 10 planes with a 3 μm thickness (AD). Representative THUNDER images of pHIV-Fgfr4-injected female mice (dorsal white matter) 2 mm rostral to the lesion at 6 weeks after SCI (EH). Note the increase in βIII-tubulin expression in pHIV-Fgfr4-injected female mice compared to pHIV-mCherry-injected group (AD). Representative confocal images of pHIV-Fgfr4-injected female mice in close vicinity of the lesion site, 6 weeks after SCI (IL). Micrographs confirm βIII-tubulin protein expression in a sub-population of transduced astrocytes (arrowheads, (H)). Scale bars: 20 µm.
Figure 3
Figure 3
pHIV-Fgfr4 vector injection immediately after SCI improves functional recovery differentially in female and male mice. Open field graphs displaying the total distance covered by females (A), and males (B). Graph showing detected ipsilateral hindpaw using CatwalkTM in females (C), and males (D) during the first week after SCI (correspond to black insets in E and F respectively). CatWalkTM graphs showing the print position ipsilateral (E,F) and contralateral to the lesion (G,H) and the time of max contact of the hind paw contralateral to the lesion (I,J). Female (A,C,E,G,I) and male mice (B,D,F,H,J). All values were normalized to data obtained before SCI using the same animal (dashed line, 100%). In all graphs, animals that received injections of the experimental vector (pHIV-Fgfr4, blue) and the control vector (pHIV-mCherry, red) are represented. Data are expressed as mean ± SEM. Two-way ANOVA * p < 0.05, ** p < 0.01 (A,C,H) followed by Bonferroni post hoc test. Number of C57BL6/6J mice: 12 females and 6 males (pHIV-Fgfr4 vector) and 12 females and 7 males (pHIV-mCherry).
Figure 4
Figure 4
pHIV-Fgfr4 vector injection immediately after SCI preserves spinal cord tissues. Representative ex vivo axial DW-MRI (AF) of the spinal cord from a C57BL6/6J female mouse that underwent injury and pHIV-Fgfr4 vector injections. Photograph within the lesion epicenter (B,E), 1 mm rostral (A,D), and 1 mm caudal (C,F) to the lesion site. Manual segmentations (DF) of the spared grey matter (blue), the spared white matter (green), and the injured tissue (red). In females (G,I,K) and males (H,J,L), lesion area at the epicenter (G,H), lesion extension (I,J), and lesion volume (K,L) were analyzed. In all graphs, data from animals that received the experimental vector (blue), and the control vector (red) are represented. Data are expressed as mean per mouse ± SEM. Student’s un-paired t-test: * p < 0.05 and *** p < 0.001. Number of C57BL6/6J mice: 12 females and 6 males (pHIV-Fgfr4 vector) and 12 females and 7 males (pHIV-mCherry vector). Analyses were performed 6 weeks after SCI. AUC: Area under the curve. Scale bar (AF): 1 mm.
Figure 5
Figure 5
Quantification of spared myelin after SCI and pHIV-Fgfr4 injections. Axial section of a mouse spinal cord stained with fluoromyelin (A). White boxes indicate locations of the 6 high magnification images acquired per sections for quantifications of spared myelin fibers (A). Representative image of the white matter in an uninjured mouse (B). Representative images of the white matter in pHIV-mCherry (C,E), and pHIV-Fgfr4 (D,F) animals at 5 mm caudal to the lesion. Representative images on the ipsilateral (C,D) and contralateral (E,F) side of the lesion. Arrowheads point to damaged myelin fibers (uncomplete myelin sheath; (C)–(E)) and arrow point to spared myelin fibers (complete myelin sheath (B)–(F)). Quantifications were performed on 1 section located 3 mm rostral and 1 section located 3 mm caudal to the lesion epicenter. Density of the overall spared myelinated fibers (rostral and caudal; ipsilateral and contralateral; equivalent age and locations matches were taken for uninjured) (G). Density of spared myelinated fibers (rostral and caudal) ipsilateral and contralateral to the lesion site (H). Data from uninjured animals (black), animals that received the experimental vector (blue), and the control vector (red) are represented. Data are expressed as mean per mouse ± SEM. Student’s un-paired t-test: * p ≤ 0.05 (G) and paired t (H) ** p ≤ 0.01. Number of female C57BL6/6J mice: 3 uninjured, 6 control (pHIV-mCherry), and 5 experimental (pHIV-Fgfr4). In both groups (pHIV-mCherry and pHIV-Fgfr4) spinal cords were analyzed 6 weeks after SCI and vector injections. Scale bars: 100 µm (A) and 50 µm (BF).
Figure 6
Figure 6
pHIV-Fgfr4 vector injection immediately after SCI reduces astrocyte reactivity caudal to the lesion. Glial reactivity was assessed using peroxidase immunohistochemistry for astrocyte (GFAP; AF,B’,E’), and microglia (IBA1; KP,L’,O’). Brightfield micrographs of GFAP in the injured spinal cords of mice injected with the control vector (AC) or the experimental vector (DF). Micrographs were taken at the lesion epicenter on the contralateral side (B,E), rostral (A,D), and caudal (C,F) to the lesion site. Zoomed-in micrographs taken in the lesion site of the control (B’) and the experimental (E’) group (black insets in (B) and (E), respectively). Quantifications of GFAP expression were performed rostral (G,H) and caudal (I,J) to the lesion site in the grey (G,I) and the white matters (H,J). Immunoperoxidase staining for IBA1 (KP) was performed in the injured spinal cords of mice injected with the control vector (KM) or the experimental vector (NP). Micrographs were taken at the lesion epicenter on the contralateral side of the lesion (L,O), rostral (K,N), and caudal (M,P) to the lesion site. Zoomed-in micrographs taken in the lesion site of the control (L’) and the experimental (O’) group (black insets in L and O, respectively). Quantifications of IBA1 expression were performed rostral (Q,R), and caudal (S,T) to the lesion site in the grey (Q,S), and the white matters (R,T). In all graphs, data from animals that received the experimental vector (blue), and the control vector (red) are represented. Data are expressed as mean per mouse ± SEM. Student’s unpaired t with Welch’s correction * p ≤ 0.05. Number of C57BL6/6J female mice: 5 pHIV-Fgfr4 and 6 pHIV-mCherry. Analyses were performed at 6 weeks after SCI. Scale bars: 100 µm (AF,KP) and 25 µm (B’,E’L’,O’).
Figure 7
Figure 7
Quantification of neuromuscular junctions in the gastrocnemius-soleus-plantaris muscular complex. Bright-field micrographs showing gastrocnemius–soleus–plantaris muscle complex of the hind limb ipsilateral to the spinal cord lesion in an untreated mouse (A). Quantification of muscle surface area assessed in pHIV-mCherry (red) and pHIV-Fgfr4 (blue) groups ipsilateral and contralateral to the lesion side (B). Neuromuscular junctions (C) quantification in muscles of pHIV-mCherry and pHIV-Fgfr4 mice were performed ipsilateral and contralateral to the lesion side (D). Data are expressed as mean per mouse ± SEM. Student’s unpaired t with Welch’s correction and paired t-test (comparison ipsi vs. contra). Number of female mice: 5 C57BL6/6J experimental mice; 7 C57BL6/6J control mice. Animals were sacrificed at 6 weeks after SCI. Scale bar: 1 mm (A) and 100 µm (C).

References

    1. Kumar R., Lim J., Mekary R.A., Rattani A., Dewan M.C., Sharif S.Y., Osorio-Fonseca E., Park K.B. Traumatic Spinal Injury: Global Epidemiology and Worldwide Volume. World Neurosurg. 2018;113:e345–e363. doi: 10.1016/j.wneu.2018.02.033. - DOI - PubMed
    1. Kroner A., Almanza J.R. Role of microglia in spinal cord injury. Neurosci. Lett. 2019;709:134370. doi: 10.1016/j.neulet.2019.134370. - DOI - PubMed
    1. Cregg J.M., DePaul M.A., Filous A.R., Lang B.T., Tran A., Silver J. Functional regeneration beyond the glial scar. Exp. Neurol. 2014;253:197–207. doi: 10.1016/j.expneurol.2013.12.024. - DOI - PMC - PubMed
    1. Karimi-Abdolrezaee S., Billakanti R. Reactive Astrogliosis after Spinal Cord Injury—Beneficial and Detrimental Effects. Mol. Neurobiol. 2012;46:251–264. doi: 10.1007/s12035-012-8287-4. - DOI - PubMed
    1. Sofroniew M.V. Molecular dissection of reactive astrogliosis and glial scar formation. Trends Neurosci. 2009;32:638–647. doi: 10.1016/j.tins.2009.08.002. - DOI - PMC - PubMed

Publication types

Substances