. 2023 Feb 8;12(4):540.
doi: 10.3390/cells12040540.

Infrared Laser Effects on Cell Projection Depend on Irradiation Intermittence and Cell Activity

Affiliations

Infrared Laser Effects on Cell Projection Depend on Irradiation Intermittence and Cell Activity

Norma Medina-Villalobos et al. Cells. .

Abstract

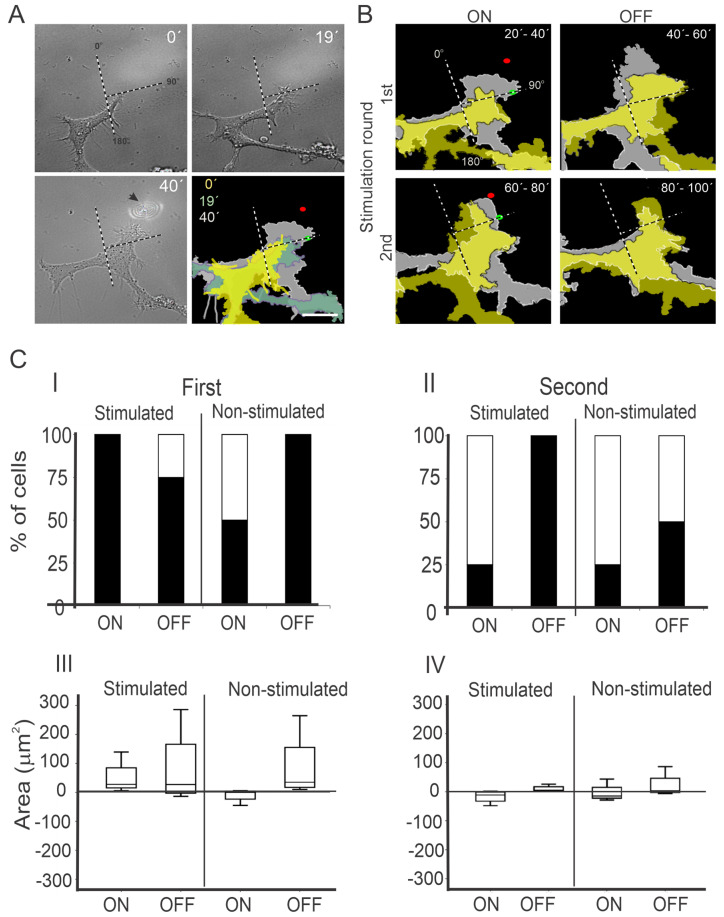
Highly focused near-infrared (NIR) lasers have been used to induce fibroblast and neuron protrusions in a technique called optical guidance. However, little is known about the biochemical and biophysical effects that the laser provokes in the cell and optimal protocols of stimulation have not yet been established. Using intermittent NIR laser radiation and multivariate time series representations of cell leading edge movement, we analyzed the direction and velocity of cell protrusions. We found that the orientation and advance of PC12 neuron phenotype cells and 3T3 fibroblasts protrusions remain after the laser is turned off, but the observed increase in velocity stops when radiation ceases. For an increase in the speed and distance of cell protrusions by NIR laser irradiation, the cell leading edge needs to be advancing prior to the stimulation, and NIR irradiation does not enable the cell to switch between retracting and advancing states. Using timelapse imaging of actin-GFP, we observed that NIR irradiation induces a faster recruitment of actin, promoting filament formation at the induced cell protrusions. These results provide fresh evidence to understand the phenomenon of the optical guidance of cell protrusions.

Keywords: actin; cells projection; optical guidance.


Conflict of interest statement

The authors declare no conflict of interest.

Figures

Figure 1
Figure 1
Optical guidance of PC12 cells during the ON and OFF period of laser stimulation. (A) Example of a time lapse of DIC microscopy images of PC12 cells obtained before NIR laser stimulation (T = 0′, T = 19′) and after 20 min of NIR laser irradiation (T = 40′). The arrow in the 40’ frame indicates the laser spot. The superposition of colored areas shows the direction of projection of the growth cones. (B) Example of growth cone projection while the laser was ON and OFF, respectively. The superimposed colored areas indicate the growth cone contour at beginning (yellow) and the end (gray) of the temporal periods indicated at the right-top corner of each frame. Dotted lines in (A) and (B) show the division in two zones (0–90° and 90–180°), green and red dots mark the position of the laser spot at the beginning and the end of the stimulation, respectively. (C) Quantification of PC12 growth cone projection. Subpanels I and II show the percentage of cells with increased (black) or decreased (white) growth cone area at stimulated (0–90°) and non-stimulated quadrants (90–180°), and during the laser ON and OFF periods at the first (I) and second (II) round of laser stimulation. III and IV show box-and-whisker diagrams of the difference of the growth cone areas at the end and beginning of the 20 min periods (refer to Section 2.4), at stimulated and non-stimulated quadrants, during the ON and OFF periods, in the first (III) and second (IV) round of laser stimulation. The scale bars in (A,B) represent 15 µm.
Figure 2
Figure 2
PC12 growth cone projections with fixed laser position at the on and off period of laser stimulation. (A) Similar to Figure 1B, with static laser. Stimulated quadrants, 45–135°, delimited with blue dotted lines, and non-stimulated zones. Green dots mark the position of the laser during all the stimulation period. (B) Similar to Figure 1C. The scale bar in A represents 15 µm.
Figure 3
Figure 3
Quantification of PC12 growth cone velocity of projection. Multivariate time series plot of discretized velocities of projection at different angles. (AC, cell #1) and (DF, cell #2). Green, purple, and gray correspond to positive, negative, and null velocities, respectively. Black squares indicate the angles where the laser was located and blue arrows the displacement of the spot. In both cells, positive velocities were registered for at least 10 min previous to the first round of irradiation, at the angles of the spot location (red dotted squares). (B,E) show the median values of the velocities of projection, and (C,F) the median values of the cumulative distance, in both cases at the angles where the spots were located during the irradiated (ON), non-irradiated (OFF), or previous to irradiation (PREV) periods.
Figure 4
Figure 4
Similar to Figure 3, for cells #3 and #4 (AC) and (DF), respectively.
Figure 5
Figure 5
Percentage of change in membrane projection of PC12 active or static cells under laser irradiation. The percentage of change of (A) average speed, (B) average velocity, and (C) average distance was obtained from the irradiated regions of cell membranes before and after laser stimulation. Black columns correspond to cells that were projecting for at least five minutes before the beginning of laser irradiation (active); white columns correspond to cells that were immobile or retracting at the beginning of the laser irradiation (static). Bars represent the standard error. Asterisk (*) indicates statistically significant difference between the two conditions (Student’s t test p < 0.05). n = 8 cells per condition.
Figure 6
Figure 6
Effects of laser stimulation on actin-GFP. (A) Selected images of a 3T3 cell expressing actin-GFP during 12 min previous to its stimulation (PREV) and while laser-stimulated (ON). Red dots indicate the position of the laser spot during the ON period. Dotted lines indicate the rectangular area selected for the kymograph analysis. Widened copies of the red rectangles are shown to indicate the axis of the position dimension (X) of the kymographs. (B) Kymographs obtained from the cell area adjacent to the laser spot (ON) or from an equivalent area during the period of time without the laser stimulation (PREV). (C) Temporal fluorescence intensity change in the kymographs averaged over the observation period (0–12 min), as a function of the position along the x axis along the region of interest shown by the dashed rectangles. The non-stimulated condition is represented by a blue line, while the orange line corresponds to the laser-stimulated condition. (D) Selected images of a 3T3 cell expressing actin-GFP under laser stimulation (ON). Laser spot (red dots) was displaced, while the cell advanced at different time intervals. Red dotted lines indicate the selected areas for the kymograph computations at the time periods when the cell was projecting (0–5, 10–15, and 31–35 min). Widened copies of the red rectangles are shown to indicate the axis of the position dimension (X) of the kymographs. Blue dotted lines indicate an equivalent area in the same cell without laser stimulation. (E) Kymographs obtained from non-stimulated (NS) or laser stimulated areas (S). (F) Similar to C, for the kymographs shown in (E). Scale bars in (A) and (D) correspond to 10 µm.

Similar articles

References

    1. Albrecht-Buehler G. Surface extensions of 3T3 cells towards distant infrared light sources. J. Cell Biol. 1991;114:493–502. doi: 10.1083/jcb.114.3.493. - DOI - PMC - PubMed
    1. Albrecht-Buehler G. A long-range attraction between aggregating 3T3 cells mediated by near-infrared light scattering. Proc. Natl. Acad. Sci. USA. 2005;102:5050–5055. doi: 10.1073/pnas.0407763102. - DOI - PMC - PubMed
    1. Avila R., Medina-Villalobos N., Tamariz E., Chiu R., Lopez-Marín L.M., Acosta A., Castaño V. Optical tweezers experiments for fibroblast cell growth stimulation; Proceedings of the Biophotonics: Photonic Solutions for Better Health Care IV; Brussels, Belgium. 14–17 April 2014; p. 91291U. - DOI
    1. Carnegie D.J., Cizmar T., Baumgartl J., Gunn-Moore F.J., Dholakia K. Automated laser guidance of neuronal growth cones using a spatial light modulator. J. Biophotonics. 2009;2:682–692. doi: 10.1002/jbio.200910043. - DOI - PubMed
    1. Carnegie D.J., Stevenson D.J., Mazilu M., Gunn-Moore F., Dholakia K. Guided neuronal growth using optical line traps. Opt. Express. 2008;16:10507–10517. doi: 10.1364/OE.16.010507. - DOI - PubMed

Publication types

LinkOut - more resources