. 2023 Feb 10;12(4):578.
doi: 10.3390/cells12040578.

Pan-Genomic Regulation of Gene Expression in Normal and Pathological Human Placentas

Affiliations

Pan-Genomic Regulation of Gene Expression in Normal and Pathological Human Placentas

Clara Apicella et al. Cells. .

Abstract

In this study, we attempted to find genetic variants affecting gene expression (eQTL = expression Quantitative Trait Loci) in the human placenta in normal and pathological situations. The analysis of gene expression in placental diseases (Pre-eclampsia and Intra-Uterine Growth Restriction) is hindered by the fact that diseased placental tissue samples are generally taken at earlier gestations compared to control samples. The difference in gestational age is considered a major confounding factor in the transcriptome regulation of the placenta. To alleviate this significant problem, we propose here a novel approach to pinpoint disease-specific cis-eQTLs. By statistical correction for gestational age at sampling as well as other confounding/surrogate variables systematically searched and identified, we found 43 e-genes for which proximal SNPs influence expression level. Then, we performed the analysis again, removing the disease status from the covariates, and we identified 54 e-genes, 16 of which are identified de novo and, thus, possibly related to placental disease. We found a highly significant overlap with previous studies for the list of 43 e-genes, validating our methodology and findings. Among the 16 disease-specific e-genes, several are intrinsic to trophoblast biology and, therefore, constitute novel targets of interest to better characterize placental pathology and its varied clinical consequences. The approach that we used may also be applied to the study of other human diseases where confounding factors have hampered a better understanding of the pathology.

Keywords: expression Quantitative Trait Loci; placenta; preeclampsia.


Conflict of interest statement

The authors declare no conflict of interest.

Figures
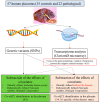
Figure 1
Figure 1
Overview of the experimental design. SNP = Single Nucleotide Polymorphism; PCA = Principal Component Analysis; SVA = Surrogate Variable Analysis; eQTL = expression Quantitative Trait Locus.
Figure 2
Figure 2
Definition of covariates and surrogate variables potentially affecting the gene expression dataset. (A) Eigencorplot expresses the results of Pearson correlation between the clinical and technical variables and the first 10 principal components obtained from the PCA performed on the gene expression dataset. A negative correlation is expressed in blue, and a positive correlation is expressed in red. Within each pair the correlation coefficient is displayed with statistical significance. (* = p-value ≤ 0.05, ** = p-value ≤ 0.01, *** = p-value ≤ 0.001). (B) Correlation matrix between the 9 clinical and experimental variables, first 10 PCs of gene expression PCA, and 4 identified surrogate variables, having effects on global transcriptomic changes. Only statistically significant correlations (p-value ≤ 0.05) are displayed as dots of increasing size as a measure of the correlation coefficient. Positive correlations are displayed in blue, and negative correlations are displayed in red. In yellow boxes are the variables that were kept as covariables for subtracting their effect (see text).
Figure 3
Figure 3
Overview of the cisQTL results for the ALL COVARIATES dataset. (A) Manhattan plot showing each tested SNP as a dot in its genomic position on the x-axis, stratified by chromosomes. The y-axis expresses the -LOG10 of the p-value of the interaction with the eGene. Suggestive line in red shows the 10 × 10−8 threshold, while in blue, the threshold corresponding to a p-value of 0.05 adjusted for the number of tests (False Discovery Rate) = 1.24 × 10⁻⁴. (B) Plots showing the localization of the tested SNPs within the genomic regions on chromosome 6, containing ZSCAN9 and TOB2P1, and chromosome 11, where AQP11, LOC646029, CASP1P2, and CARD17 are located. The x-axis expresses the genomic coordinates, while in the y-axis, the -LOG10 of the p-value, the horizontal line sets the level for FDR ≤ 0.05. The vertical lines represent the start and end sites for each of the genes. eSNPs that were found to be in common between eGenes in the same region are highlighted in yellow.
Figure 4
Figure 4
Comparing the experimental parameters for the ALL COVARIATES and MINUS DISEASE eQTL datasets. (TOP) Table comparing the parameters of cis-eQTL analyses performed for different Residual Variance (RV) thresholds (0.5-0.95) for ALL COVARIATES and MINUS DISEASE datasets. Depending on the RV threshold, different lists of genes were included in the cisQTL analysis, resulting in 10 output cis-QTL datasets for each approach, ALL COVARIATES in grey and MINUS DISEASE in white. (BOTTOM) Cis-eQTL enrichment graphs for each approach at the different thresholds of residual variance tested. Showing the number of significant eGenes (blue), eSNP (orange), and enrichment expressed as number of eSNP/eGene in grey.
Figure 5
Figure 5
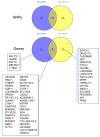
Overlap between cis-QTL datasets ALL COVARIATES and MINUS DISEASE. Venn diagrams showing the overlap between the eSNPs and eGenes identified as statistically significant (FDR ≤ 0.05) in ALL COVARIATES (blue) and MINUS DISEASE (yellow).
Figure 6
Figure 6
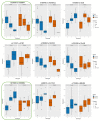
Boxplots of eGene expression in relation to the best-eSNP genotype, stratified by Group: Control vs. Disease. eGenes ZSCAN9, ERAP2, AQP11, RP1-97J1.2, IL36RN, ZFYVE19, FUT10, PTTG1, DNAJC15.The genotype of each SNP is expressed as 0, 1, 2, and the gene expression data corresponds to the raw data as mean fluorescence value. CTRL = Control; IUGR = Intra-uterine Growth Restriction; PE = Preeclampsia. Genes discussed in the text, because of their relevance to placental biology, are highlighted in green.
Figure 7
Figure 7
Boxplots of eGene expression in relation to the best-eSNP genotype, stratified by Group: Control vs. Disease. eGenes TAS2R64P, AC009542.2, CBLB, GTSF1, NDUFS5, C8orf46, LINC00654, SLC13A5, MIR4299.The genotype of each SNP is expressed as 0, 1, 2, and the gene expression data corresponds to the raw data as mean fluorescence value. CTRL = Control; IUGR = Intra-uterine Growth Restriction; PE = Preeclampsia. Genes discussed in the text, because of their relevance to placental biology, are highlighted in green.
Figure 8
Figure 8
Boxplots of eGene expression in relation to the best-eSNP genotype, stratified by Group: Control vs Disease. eGenes C8orf89, CASQ1, ERICH1. The genotype of each SNP is expressed as 0, 1, 2, and the gene expression data corresponds to the raw data as mean fluorescence value. CTRL = Control; IUGR = Intra-uterine Growth Restriction; PE = Preeclampsia. Genes discussed in the text, because of their relevance to placental biology, are highlighted in green.

References

    1. Griffith O.W., Chavan A.R., Protopapas S., Maziarz J., Romero R., Wagner G.P. Embryo implantation evolved from an ancestral inflammatory attachment reaction. Proc. Natl. Acad. Sci. USA. 2017;114:E6566–E6575. doi: 10.1073/pnas.1701129114. - DOI - PMC - PubMed
    1. Burton G.J., Fowden A.L., Thornburg K.L. Placental Origins of Chronic Disease. Physiol. Rev. 2016;96:1509–1565. doi: 10.1152/physrev.00029.2015. - DOI - PMC - PubMed
    1. Desoye G., Hauguel-de Mouzon S. The human placenta in gestational diabetes mellitus. The insulin and cytokine network. Diabetes Care. 2007;30((Suppl. S2)):S120–S126. doi: 10.2337/dc07-s203. - DOI - PubMed
    1. Lonsdale J., Thomas J., Salvatore M., Phillips R., Lo E., Shad S., Hasz R., Walters G., Garcia F., Young N., et al. The Genotype-Tissue Expression (GTEx) project. Nat. Genet. 2013;45:580–585. doi: 10.1038/ng.2653. - DOI - PMC - PubMed
    1. Leavey K., Benton S.J., Grynspan D., Kingdom J.C., Bainbridge S.A., Cox B.J. Unsupervised Placental Gene Expression Profiling Identifies Clinically Relevant Subclasses of Human Preeclampsia. Hypertension. 2016;68:137–147. doi: 10.1161/HYPERTENSIONAHA.116.07293. - DOI - PubMed

Publication types

LinkOut - more resources