. 2023 Feb 14;12(4):615.
doi: 10.3390/cells12040615.

Decoupling of mRNA and Protein Expression in Aging Brains Reveals the Age-Dependent Adaptation of Specific Gene Subsets

Affiliations

Decoupling of mRNA and Protein Expression in Aging Brains Reveals the Age-Dependent Adaptation of Specific Gene Subsets

Inès Khatir et al. Cells. .

Abstract

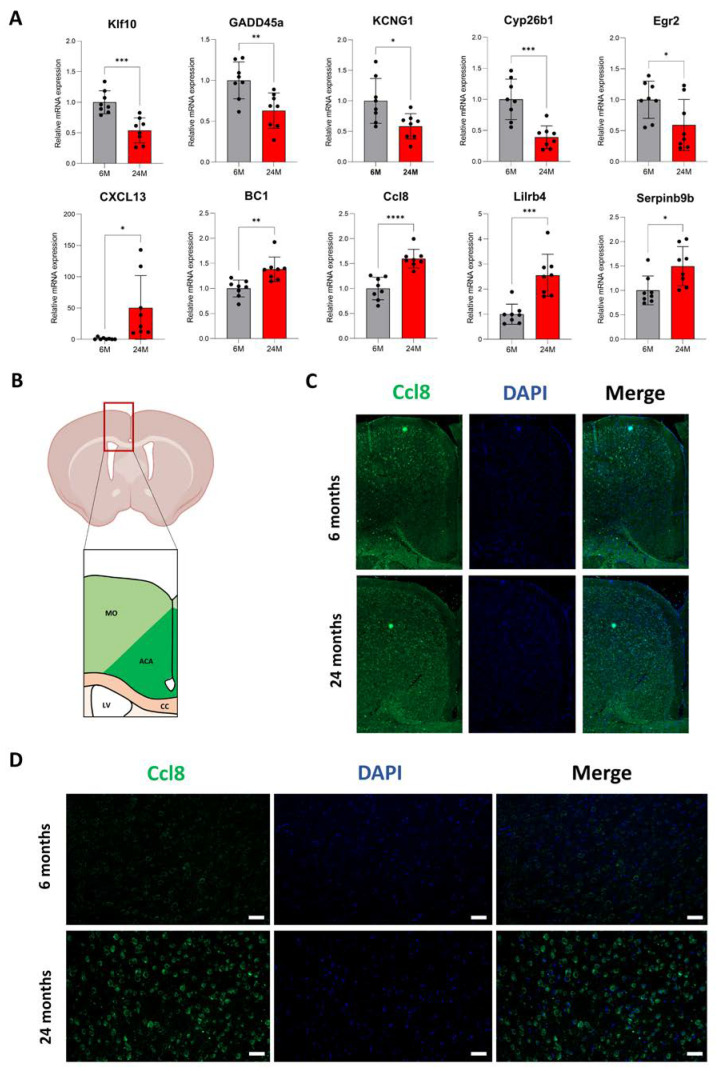
During aging, changes in gene expression are associated with a decline in physical and cognitive abilities. Here, we investigate the connection between changes in mRNA and protein expression in the brain by comparing the transcriptome and proteome of the mouse cortex during aging. Our transcriptomic analysis revealed that aging mainly triggers gene activation in the cortex. We showed that an increase in mRNA expression correlates with protein expression, specifically in the anterior cingulate cortex, where we also observed an increase in cortical thickness during aging. Genes exhibiting an aging-dependent increase of mRNA and protein levels are involved in sensory perception and immune functions. Our proteomic analysis also identified changes in protein abundance in the aging cortex and highlighted a subset of proteins that were differentially enriched but exhibited stable mRNA levels during aging, implying the contribution of aging-related post- transcriptional and post-translational mechanisms. These specific genes were associated with general biological processes such as translation, ribosome assembly and protein degradation, and also important brain functions related to neuroplasticity. By decoupling mRNA and protein expression, we have thus characterized distinct subsets of genes that differentially adjust to cellular aging in the cerebral cortex.

Keywords: aging; brain; cortex; mRNA; protein; proteome; transcriptome.


Conflict of interest statement

The authors have declared no competing interests.

Figures

Figure 1
Figure 1
Anatomical characteristics of the aging brain. (A) Schematic depicting a coronal brain cut, with the two areas where cortical thickness was measured. The blue area represents the “top” of the cerebral cortex, comprising the anterior cingulate area, the motor area and the primary somatosensory area (limbs). The orange area represents the “bottom” of the cerebral cortex, with the supplemental somatosensory area (barrel and nose), the visceral area, the gustatory area and the piriform area. The thickness of the top and bottom areas was measured at different locations, as indicated by numbered arrows. (B) Coronal cuts of the whole brain of 6- and 24-month-old mice (respectively grey and red; n = 6 per age group; 3 males and 3 females) were stained with hematoxylin and eosin, and the thickness of the top and bottom areas was measured. (*) p < 0.0001 in one-way ANOVA; ns: not significant. (C) Graph representing the wet weight of the brain after dissection (n = 6 per age group; 3 males and 3 females). ns: not significant from unpaired t-test with equal means.
Figure 2
Figure 2
Age-related changes in the transcriptome signature of the cerebral cortex. (A) Principal component analysis (PCA, explaining 85% of the variance in total) for the gene expression of 6-month-old (red) and 24-month-old (blue) cortices (n = 3 per age group). The cross represents the centroid for each sample set. (B) Volcano plot of differentially expressed genes, mapping the 400 up-regulated genes (red) and 27 down-regulated genes (blue) at a 1% FDR. FC, fold change. (C) Hierarchical clustering of genes showing significant differential expression between 6- and 24-month-old cortices. Red and blue indicate relatively higher and lower expression, with genes independently scaled to a mean of zero. (D,E) Gene Ontology analysis of up-regulated (D) and down-regulated (E) genes using the ShinyGO tool (version 0.76.1). The pathway database used was the GO Biological Process. Parameters were set at a 0.05 FDR cut-off with no redundancy in GO terms. (F,G) Pathways enriched among up-regulated (F) and down-regulated (G) genes using the BioPlanet 2019 pathway database. Pathways are sorted by p-value ranking.
Figure 3
Figure 3
Validation of candidate genes differentially expressed in the aging cortex. (A) mRNA levels of Klf10, GADD45a, KCNG1, Cyp26b1, Egr2, CXCL13, BC1, Ccl8, Lilrb4b and Serpina9b were measured in cortices of 6-month-old (grey) and 24-month-old (red) mice by quantitative PCR and normalized to that of RPLP0 (n = 8 per age group; 4 males and 4 females). Results are indicated as mean ± SD. (*) p < 0.04, (**) p < 0.005, (***) p < 0.001, (****) p < 0.0001 from unpaired t-test with equal means. (B) Schematic representation of the cortex area analyzed by immunofluorescence. Motor area (MO), anterior cingulate area (ACA), corpus callosum (CC), lateral ventricle (LV). (C,D) Ccl8 immunofluorescence on coronal cuts of 6-month-old and 24-month-old brains. Images illustrate the representative staining in the whole top cortex area (C) and in the anterior cingulate area (D) with the Ccl8 antibody (green; left panel) and DAPI (blue; middle panel) (n = 3 per age group). The right panel constitutes a merged image of Ccl8 and DAPI signals. Scale bar: 50 μm.
Figure 4
Figure 4
Age-related changes in the proteome of the cerebral cortex. (A) Volcano plot of the distribution of differentially enriched proteins, mapping the 164 down-regulated proteins (red) and 42 up-regulated proteins (blue). Data analysis was performed using Prostar software (log2 fold change threshold: 1, –log10 p-value: 1.3) (n = 2). (B) Hierarchical clustering of proteins showing significant differential enrichment in the aging cortex, based on the ratio of the area below the curve. Green and red indicate relatively high and low enrichment, with a ratio independently scaled to a mean of zero. (C,D) Gene Ontology analysis of proteins up-regulated (C) and down-regulated (D) in the aging cortex using the ShinyGO tool. The pathway database used was the GO Biological Process. Parameters were set at a 0.05 FDR cut-off with no redundancy in GO terms. (E) Heatmap of RNA transcript expression for each gene encoding differentially enriched proteins in 6 and 24-month-old cortices. Samples were independently scaled to a mean of zero. Green and red side bars indicate, respectively, up- and down-regulated proteins during cortex aging. (F) Heatmap of peptides quantified by PRM mass spectrometry. Each horizontal line represents one peptide. Green and red respectively indicate high and low expression. Values were based on the ratio of the area below the curve for 6- and 24-month-old cortex samples (n = 2 per age group) compared to that of the two Atp5b and Got2 control peptides. (G) Peptide quantification by PRM mass spectrometry. The area of each peptide was normalized by that of Got2 for 6-month-old (grey) and 24-month-old (red) cortex samples (n = 2 per age group; three technical replicates using two unique peptides). Results are indicated as mean ± SD.
Figure 5
Figure 5
Analysis of GAP43 expression in the aging cortex. (A) Protein levels of GAP43 within the 6-month-old (grey) and 24-month-old (red) cortex samples were analyzed by Western blot (left panel). Actin was used as a loading control. On the right panel, quantification of the GAP43 signal (normalized by the actin signal) (n = 4 per age group). Results are indicated as mean ± SD. (****) p < 0.001 from unpaired t-test for equal means. (B) mRNA levels of GAP43 were measured by quantitative PCR and normalized to that of RPLP0 (n = 8 per age group). Results are indicated as mean ± SD. (C) GAP43 immunofluorescence on coronal cuts of 6-month-old and 24-month-old brains. Images illustrate the representative staining in the cortex motor area with the GAP-43 antibody (green; left panel) and DAPI (blue; middle panel). The right image panel constitutes a merged image of GAP43 and DAPI signals. A quantitative comparative analysis of GAP43 expression (n = 6 per age group) is displayed on the right. (****) p < 0.001 from unpaired t-test for equal means. Scale bar: 100 μm.

Similar articles

Cited by

References

    1. Moskalev A.A., Shaposhnikov M.V., Plyusnina E.N., Zhavoronkov A., Budovsky A., Yanai H., Fraifeld V.E. The role of DNA damage and repair in aging through the prism of Koch-like criteria. Ageing Res. Rev. 2013;12:661–684. doi: 10.1016/j.arr.2012.02.001. - DOI - PubMed
    1. Hewitt G., Jurk D., Marques F.D., Correia-Melo C., Hardy T., Gackowska A., Anderson R., Taschuk M., Mann J., Passos J.F. Telomeres are favoured targets of a persistent DNA damage response in ageing and stress-induced senescence. Nat. Commun. 2012;3:708. doi: 10.1038/ncomms1708. - DOI - PMC - PubMed
    1. Horvath S. DNA methylation age of human tissues and cell types. Genome Biol. 2013;14:R115. doi: 10.1186/gb-2013-14-10-r115. - DOI - PMC - PubMed
    1. Horvath S., Raj K. DNA methylation-based biomarkers and the epigenetic clock theory of ageing. Nat. Rev. Genet. 2018;19:371–384. doi: 10.1038/s41576-018-0004-3. - DOI - PubMed
    1. Fraga M.F., Esteller M. Epigenetics and aging: The targets and the marks. Trends Genet. 2007;23:413–418. doi: 10.1016/j.tig.2007.05.008. - DOI - PubMed

Publication types

Grants and funding