. 2023 Feb 16;12(4):636.
doi: 10.3390/cells12040636.

Administration of Secretome Derived from Human Mesenchymal Stem Cells Induces Hepatoprotective Effects in Models of Idiosyncratic Drug-Induced Liver Injury Caused by Amiodarone or Tamoxifen

Affiliations

Administration of Secretome Derived from Human Mesenchymal Stem Cells Induces Hepatoprotective Effects in Models of Idiosyncratic Drug-Induced Liver Injury Caused by Amiodarone or Tamoxifen

Ya-Lin Huang et al. Cells. .

Abstract

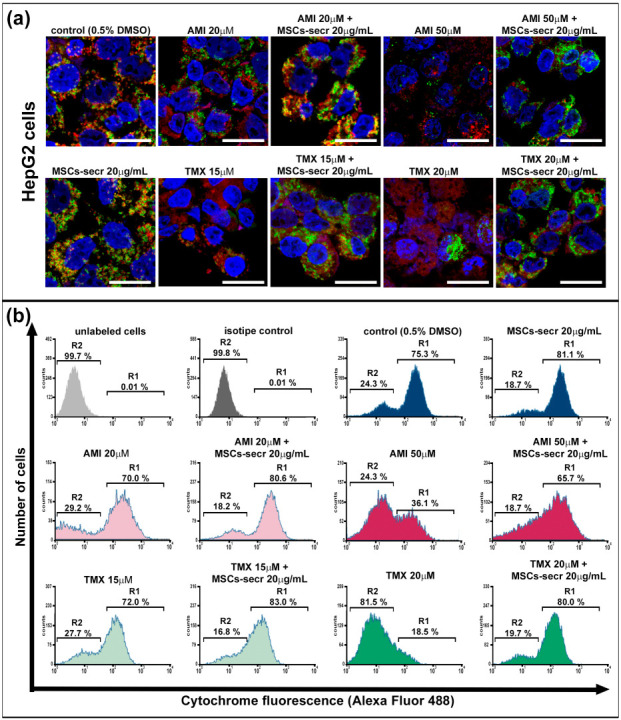
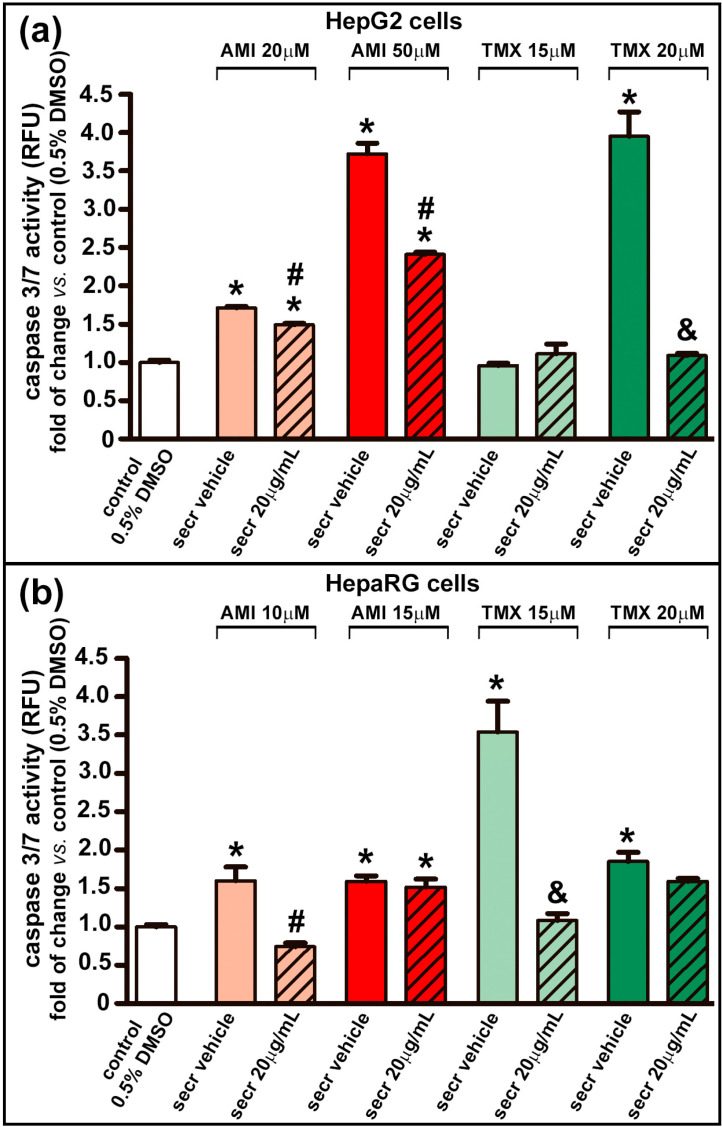
Drug-induced liver injury (DILI) is one of the leading causes of acute liver injury. While many factors may contribute to the susceptibility to DILI, obese patients with hepatic steatosis are particularly prone to suffer DILI. The secretome derived from mesenchymal stem cell has been shown to have hepatoprotective effects in diverse in vitro and in vivo models. In this study, we evaluate whether MSC secretome could improve DILI mediated by amiodarone (AMI) or tamoxifen (TMX). Hepatic HepG2 and HepaRG cells were incubated with AMI or TMX, alone or with the secretome of MSCs obtained from human adipose tissue. These studies demonstrate that coincubation of AMI or TMX with MSC secretome increases cell viability, prevents the activation of apoptosis pathways, and stimulates the expression of priming phase genes, leading to higher proliferation rates. As proof of concept, in a C57BL/6 mouse model of hepatic steatosis and chronic exposure to AMI, the MSC secretome was administered endovenously. In this study, liver injury was significantly attenuated, with a decrease in cell infiltration and stimulation of the regenerative response. The present results indicate that MSC secretome administration has the potential to be an adjunctive cell-free therapy to prevent liver failure derived from DILI caused by TMX or AMI.

Keywords: amiodarone; cell free therapy; drug-induced liver injury; hepatic regeneration; tamoxifen.


Conflict of interest statement

The authors declare no conflict of interest.

Figures

Figure 1
Figure 1
MSC secretome presented a cytoprotective effect in hepatic cells incubated with AMI or TMX. To determine the cytoprotective effect of MSC secretome on (a) HepG2 and (b) HepaRG cells, both cell lines were incubated with AMI (light and dark red bars) or TMX (light and dark green bars) at the indicated concentrations, alone or coincubated with two concentrations of MSC secretome (20 or 70 µg/mL—line pattern bars), or the secretome vehicle (PBS) for 24 h. As a control group, cells were incubated with the drug solvent (0.5% DMSO—white bars). Cell viability was measured by an MTT assay at the end of the treatment, and control group value was obtained as 100%. AMI and TMX significantly decreased cell viability in both cell types in a concentration-dependent manner, while coincubation with MSC secretome (both concentrations) led to increased cell viability in both cell lines. Data are presented as means ± SEM (n = 4) of three independent experiments. * p < 0.05 vs. control group (0.5% DMSO); # p < 0.05 vs. AMI plus secretome vehicle, of the same experimental group (same AMI concentration); & p < 0.05 vs. TMX plus secretome vehicle, of the same experimental group (same TMX concentration). secr vehicle: MSC secretome vehicle (PBS); secr: MSC secretome; AMI: amiodarone; TMX: tamoxifen.
Figure 2
Figure 2
MSC secretome decreased the release of LDH in hepatic cells incubated with TMX. The integrity of the plasma membrane was evaluated by the release of LDH into the culture medium in (a) HepG2 and (b) HepaRG cells exposed to AMI (light and dark red bars) or TMX (light and dark green bars) alone or coincubated with MSC secretome (20 µg/mL—line pattern bars), or the secretome vehicle (PBS) for 24 h. As a control group, cells were incubated with the drug solvent (0.5% DMSO—white bars). The amount of LDH released in the culture medium was determined by a fluorescent method (shown as relative fluorescence units), and expressed as fold of change vs. control group (0.5% DMSO). A dose-dependent release of LDH was observed in both cell lines when exposed to AMI or TMX. While a moderate effect was seen in HepG2 cells treated with 20 µM AMI plus secretome. Data are presented as means ± SEM (n = 4) of three independent experiments. * p < 0.05 vs. control group (0.5% DMSO); # p < 0.05 vs. AMI plus secretome vehicle, of the same experimental group (same AMI concentration); & p < 0.05 vs. TMX plus secretome vehicle, of the same experimental group (same TMX concentration). secr vehicle: MSC secretome vehicle (PBS); secr: MSC secretome; AMI: amiodarone; TMX: tamoxifen. LDH: lactate dehydrogenase. RFU: relative fluorescence units.
Figure 3
Figure 3
Coincubation with MSC secretome prevented cytochrome C release in HepG2 and HepaRG cells exposed to AMI or TMX. The release of cytochrome C was evaluated in HepG2 and HepaRG cells exposed to AMI or TMX alone or coincubated with MSC secretome (20 µg/mL) for 24 h. Mitochondrial cytochrome C release was detected by immunofluorescence in (a) HepG2 cells and (c) HepaRG cells. Representative micrographs of mitochondria (MitoTracker, red), cytochrome C (Cyt C, green), and their colocalization (merge, yellow); nuclei were counterstained with DAPI (blue). Cells with drug solvent (0.5% DMSO) were used as control group and showed maximal colocalization. Scale bars represent 20 µm. AMI and TMX induced mitochondrial damage with the concomitant release of cytochrome C in both cell lines, particularly at higher concentrations (evidenced by the loss of colocalization). On the other hand, control groups and cells coincubated with AMI or TMX plus MSC secretome exhibited colocalization of mitochondria and cytochrome C. Semiquantitative determination of cytochrome C release was evaluated by flow cytometry. Fluorescence histograms of immunolabeled cytochrome C in (b) HepG2 and (d) HepaRG cells. The cells were incubated with AMI or TMX alone or coincubated with MSC secretome (20 µg/mL) for 24 h, permeabilized with digitonin and labeled with anti-cytochrome C Alexa Fluor 488 antibody. Unlabeled cells (autofluorescence), and cells incubated with isotype antibody (isotype control), were used as negative control, whereas cells with drug solvent (0.5% DMSO) were used as control group and showed maximal cytochrome C fluorescence. Region 1 (R1) and region 2 (R2), were arbitrary defined to limit the population of cells with high and low fluorescence, respectively. Numbers at top of R1 and R2 regions are percentages of cells in each region. Control cells (0.5% DMSO) and cells incubated with MSC secretome, presented the majority of the cells in R1 (cells that have not yet released their mitochondrial cytochrome C), whereas cells exposed to the highest AMI or TMX concentrations showed a decrease in the cells in R2 (cells that have already released their mitochondrial cytochrome C). Remarkably, the MSC secretome coincubation prevented this transition. Histograms are representative of four independent experiments, presented in Figure S5.
Figure 3
Figure 3
Coincubation with MSC secretome prevented cytochrome C release in HepG2 and HepaRG cells exposed to AMI or TMX. The release of cytochrome C was evaluated in HepG2 and HepaRG cells exposed to AMI or TMX alone or coincubated with MSC secretome (20 µg/mL) for 24 h. Mitochondrial cytochrome C release was detected by immunofluorescence in (a) HepG2 cells and (c) HepaRG cells. Representative micrographs of mitochondria (MitoTracker, red), cytochrome C (Cyt C, green), and their colocalization (merge, yellow); nuclei were counterstained with DAPI (blue). Cells with drug solvent (0.5% DMSO) were used as control group and showed maximal colocalization. Scale bars represent 20 µm. AMI and TMX induced mitochondrial damage with the concomitant release of cytochrome C in both cell lines, particularly at higher concentrations (evidenced by the loss of colocalization). On the other hand, control groups and cells coincubated with AMI or TMX plus MSC secretome exhibited colocalization of mitochondria and cytochrome C. Semiquantitative determination of cytochrome C release was evaluated by flow cytometry. Fluorescence histograms of immunolabeled cytochrome C in (b) HepG2 and (d) HepaRG cells. The cells were incubated with AMI or TMX alone or coincubated with MSC secretome (20 µg/mL) for 24 h, permeabilized with digitonin and labeled with anti-cytochrome C Alexa Fluor 488 antibody. Unlabeled cells (autofluorescence), and cells incubated with isotype antibody (isotype control), were used as negative control, whereas cells with drug solvent (0.5% DMSO) were used as control group and showed maximal cytochrome C fluorescence. Region 1 (R1) and region 2 (R2), were arbitrary defined to limit the population of cells with high and low fluorescence, respectively. Numbers at top of R1 and R2 regions are percentages of cells in each region. Control cells (0.5% DMSO) and cells incubated with MSC secretome, presented the majority of the cells in R1 (cells that have not yet released their mitochondrial cytochrome C), whereas cells exposed to the highest AMI or TMX concentrations showed a decrease in the cells in R2 (cells that have already released their mitochondrial cytochrome C). Remarkably, the MSC secretome coincubation prevented this transition. Histograms are representative of four independent experiments, presented in Figure S5.
Figure 4
Figure 4
MSC secretome decreased caspase 3/7 activity in hepatic cells incubated with AMI or TMX. The activity of caspase 3/7 was evaluated in (a) HepG2 and (b) HepaRG cells exposed to AMI (light and dark red bars) or TMX (light and dark green bars) alone or coincubated with MSC secretome (20 µg/mL—line pattern bars), or the secretome vehicle (PBS) for 24 h. As a control group, cells were incubated with the drug solvent (0.5% DMSO—white bars). The activity of caspase 3/7 was evaluated by a fluorescent method (relative fluorescence units), and expressed as fold of change vs. control group (0.5% DMSO). The activity of caspase 3/7 was increased in both cell types after treatment with AMI or TMX (20 µM for HepG2 cells and 15 or 20 µM for HepaRG cells), whereas treatment with MSC secretome suppressed the activity of caspase 3/7. Data are presented as means ± SEM (n = 4) of three independent experiments. * p < 0.05 vs. control group (0.5% DMSO); # p < 0.05 vs. AMI plus secretome vehicle, of the same experimental group (same AMI concentration); & p < 0.05 vs. TMX plus secretome vehicle, of the same experimental group (same TMX concentration). secr vehicle: MSC secretome vehicle (PBS); secr: MSC secretome; AMI: amiodarone; TMX: tamoxifen. RFU: relative fluorescence units.
Figure 5
Figure 5
MSC secretome decreased intracellular ROS production in hepatic cells incubated with AMI or TMX. The production of reactive oxygen species (ROS) was evaluated in (a) HepG2 and (b) HepaRG cells exposed to AMI (red bars) or TMX (green bars) alone or coincubated with MSC secretome (20 µg/mL—line pattern bars) for 15 h. As control group, cells were incubated with the drug vehicle alone (0.5% DMSO—white bars), whereas peroxide hydrogen (H2O2) was used as positive control (gray bars). Intracellular ROS staining was performed with H2DCFDA (10 µM), and the fluorescence intensity was quantified and expressed as fold of change vs. control group (0.5% DMSO). The exposure to AMI and TMX induced ROS production in both cell lines (evidenced by the increased fluorescence), whereas the coincubation with MSC secretome reduced the ROS production. Data are presented as mean ± SEM (n = 6) of three independent experiments. * p < 0.05 vs. control group (0.5% DMSO); # p < 0.05 vs. AMI plus secretome vehicle (PBS) of the same experimental group; & p < 0.05 vs. TMX plus secretome vehicle (PBS) of the same experimental group. RFU: relative fluorescence units; secr vehicle: (secretome vehicle, PBS); secr: (MSC secretome).
Figure 6
Figure 6
Coincubation with MSC secretome enhanced HepaRG proliferation after exposure to AMI or TMX. Cell proliferation was evaluated in HepRG cells exposed to AMI (red bars) or TMX (green bars) alone or coincubated with two concentrations of MSC secretome (20 and 70 µg/mL—line pattern bars) for 24 h. As a control group, cells were incubated with the drug solvent (0.5% DMSO—white bars). Ki-67 immunoreactivity (Alexa Fluor 555, red) was evaluated by immunofluorescence. Nuclei were counterstained with DAPI (blue). The proliferation rate decreased in the HepaRG cells, when were exposed to AMI or TMX. However, coincubation with MSC secretome stimulated the proliferation of the cells in both conditions (AMI and TMX exposure). (a) Representative micrographs of HepaRG cells. Scale bars represent 50 µm. (b) Quantification of Ki-67-positive nuclei was carried out by digital image analysis. All data are presented as means ± SEM of Ki-67-positive nuclei per 100 hepatocytes in 20 high-power fields per slides and three replicates per experimental group. (c) To complement the evaluation, the expression of key factors in the proliferative response after 24 h of treatment, was evaluated by RT-qPCR, normalized against GAPDH, and expressed as fold of change vs. control group (0.5% DMSO). In line with the proliferation rate, the mRNA levels of IL-6, TNF-α and iNOS were increased in the groups incubated with MSC secretome. Data are presented as means ± SEM (n = 4) of three independent experiments. * p < 0.05 vs. control group (0.5% DMSO); # p < 0.05 vs. AMI plus secretome vehicle, of the same experimental group (same AMI concentration); & p < 0.05 vs. TMX plus secretome vehicle, of the same experimental group (same TMX concentration). secr vehicle: MSC secretome vehicle (PBS); secr: MSC secretome; AMI: amiodarone; TMX: tamoxifen.
Figure 7
Figure 7
MSC secretome administration prevented hepatic injury induced by AMI in an obese mouse model. Male mice were fed a high-fat diet (HFD) for 34 weeks and divided into three groups. During the last four weeks, one group did not receive additional treatment (HFD group), while a second group was treated daily with AMI (40 mg/kg) (HFD + AMI). The third group received MSC secretome endovenously once a week (HFD + AMI + secr). The microscopic evaluation of liver sections of obese mice treated with AMI revealed predominance of macrosteatosis, profound hepatocellular death with cytoplasmatic vacuolization, severe distortion of tissue architecture and multifocal inflammatory cellular foci. On the other hand, the coadministration of AMI with MSC secretome to obese animals resulted in great improvement of the histological appearance of the hepatic tissue, with predominance of microsteatosis and no evidence of inflammatory response. Additionally, a decrease in the number of infiltrating T lymphocytes macrophages cells in animals treated with AMI plus MSC secretome is observed. Representative micrographs of liver sections are shown. (a) Hematoxylin and eosin staining. The presence of inflammatory foci is indicated by arrows (scale bars represent 200 µm). Infiltration of T lymphocytes by (b) CD3 (Alexa 555, red) and (c) macrophages by F4/80 (Alexa 555, red) was evaluated by immunofluorescence. Nuclei were counterstained with DAPI (blue). Quantification of CD3 (e) and F4/80 (f) positive cells (arrows) was carried out by digital image analysis. The data are presented as means ± SEM of 30 random fields per animal and six animals per group. * p < 0.05 vs. control HFD mice; # p < 0.05 vs. HFD + AMI mice. To study the hepatic fibrosis, the immunoreactivity of α-SMA (d) was determined by confocal microscopy (Alexa 555, red) and the α-SMA mRNA levels (g) were measured by RT-qPCR. Alpha-SMA staining was almost completely absent from samples of untreated obese mice, however marked α-SMA immunoreactivity appear localized in perisinusoidal and pericellular areas of the livers from AMI-treated mice, while minimal staining was observed in animals treated with secretome. This result is in line with the hepatic level of α-SMA. Gene expression was normalized against GAPDH and expressed as fold of change vs. HFD-control group. Data are presented as means ± SEM (n = 4). * p < 0.05 vs. HFD-control group; # p < 0.05 vs. HFD + AMI.
Figure 8
Figure 8
MSC secretome administration enhanced proliferation and inhibited apoptosis of hepatic cells after chronic exposure to AMI. Cell proliferation and apoptosis were analyzed in all experimental groups 24 h after the last administration of AMI. The effect of MSC secretome (secr) on cell proliferation was evaluated by PCNA immunoreactivity (Alexa Fluor 555, red), while cell apoptosis was determined by TUNEL staining (FITC, green). In both cases, nuclei were counterstained with DAPI (blue). Few PCNA (+) cells were seen in steatotic livers, regardless of whether the mice had been treated chronically with vehicle (control) or AMI, whereas in the group treated with MSC secretome significantly more PCNA (+) nuclei were observed. On the other hand, mice in the obese group exposed to AMI presented an increased basal apoptotic rate, whereas a significant reduction in TUNEL (+) nuclei was observed when MSC secretome was administered jointly with AMI. Representative micrographs of liver tissue in which hepatocyte proliferation was determined by (a) PCNA labeling or (b) TUNEL are shown (arrows). Scale bars represent 50 µm. Quantification of PCNA- and TUNEL-positive nuclei was carried out by digital image analysis. All data are presented as means ± SEM for 30 random fields per animal and six animals per group. * p < 0.05 vs. control HFD mice; # p < 0.05 vs. HFD + AMI mice.
Figure 9
Figure 9
Mass spectrometry and enrichment analysis of the MSC secretome derived from adipose human MSCs. Functional enrichment analysis (p < 0.05) of the differentially expressed proteins according to the Reactome, Gene Ontology (Molecular Function and Biological Process), KEGG, and Wiki Pathways databases. Enriched functional categories were chosen on the basis of their association with the hepatic regenerative process described in this work. A total of 570 proteins were identified in the MSC secretome. The analysis revealed enrichment in proteins associated with cell cycle control and proliferation, growth factors, and organization of the extracellular matrix, as well to the immune response and lipid metabolism.

Similar articles

Cited by

References

    1. Michalopoulos G.K., Grompe M., Theise N.D. Assessing the potential of induced liver regeneration. Nat. Med. 2013;19:1096–1097. doi: 10.1038/nm.3325. - DOI - PubMed
    1. Michalopoulos G.K., Bhushan B. Liver regeneration: Biological and pathological mechanisms and implications. Nat. Rev. Gastroenterol. Hepatol. 2021;18:40–55. doi: 10.1038/s41575-020-0342-4. - DOI - PubMed
    1. Thakkar S., Li T., Liu Z., Wu L., Roberts R., Tong W. Drug-induced liver injury severity and toxicity (DILIst): Binary classifica-tion of 1279 drugs by human hepatotoxicity. Drug Discov. Today. 2020;25:201–208. doi: 10.1016/j.drudis.2019.09.022. - DOI - PubMed
    1. Walker P.A., Ryder S., Lavado A., Dilworth C., Riley R.J. The evolution of strategies to minimise the risk of human drug-induced liver injury (DILI) in drug discovery and development. Arch. Toxicol. 2020;94:2559–2585. doi: 10.1007/s00204-020-02763-w. - DOI - PMC - PubMed
    1. Andrade R.J., Chalasani N., Björnsson E.S., Suzuki A., Kullak-Ublick G.A., Watkins P.B., Devarbhavi H., Merz M., Lucena M.I., Kaplowitz N., et al. Drug-induced liver injury. Nat. Rev. Dis. Prim. 2019;5:58. doi: 10.1038/s41572-019-0105-0. - DOI - PubMed

Publication types