. 2023 Feb 17;12(4):643.
doi: 10.3390/cells12040643.

Implications of Senescent Cell Burden and NRF2 Pathway in Uremic Calcification: A Translational Study

Affiliations

Implications of Senescent Cell Burden and NRF2 Pathway in Uremic Calcification: A Translational Study

Jonas Laget et al. Cells. .

Abstract

Increased senescent cell burden and dysregulation of the nuclear factor erythroid 2-related factor 2 (NRF2) pathway have been associated with numerous age-related pathologies; however, their role in promoting vascular calcification (VC) in chronic kidney disease (CKD) has yet to be determined. We investigated whether senescence and NRF2 pathways may serve as drivers of uremia-induced VC using three complementary approaches: a novel model of induced VC in 5/6-nephrectomized rats supplemented with high phosphate and vitamin D; epigastric arteries from CKD patients with established medial calcification; and vascular smooth muscle cells (VSMCs) incubated with uremic serum. Expression of p16Ink4a and p21Cip1, as well as γ-H2A-positive cells, confirmed increased senescent cell burden at the site of calcium deposits in aortic sections in rats, and was similarly observed in calcified epigastric arteries from CKD patients through increased p16Ink4a expression. However, uremic serum-induced VSMC calcification was not accompanied by senescence. Expression of NRF2 and downstream genes, Nqo1 and Sod1, was associated with calcification in uremic rats, while no difference was observed between calcified and non-calcified EAs. Conversely, in vitro uremic serum-driven VC was associated with depleted NRF2 expression. Together, our data strengthen the importance of senescence and NRF2 pathways as potential therapeutic options to combat VC in CKD.

Keywords: NRF2; kidney failure; senescence; subtotal nephrectomy; vascular calcification.


Conflict of interest statement

The authors declare no conflict of interest.

Figures
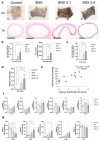
Figure 1
Figure 1
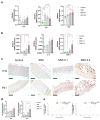
Analysis of calcification in the aortic arch and thoracic aorta, and changes in mRNA expression in thoracic aorta, of uremic Sprague Dawley rats after diet supplementation with high phosphate (1.2%) and 0.1 µg/day (SNX 0.1) or 0.4 µg/day (SNX 0.4) vitamin D. (a) Representative images of von Kossa staining in aortic arch (AA) and thoracic aorta (TA). For AA samples, after von Kossa protocol, the vessels were cut longitudinally and fixed with needles to visualize staining on the inner side. Scale bar = 1 mm. (b) Calcification was quantified as the percentage of media area stained by von Kossa and calcium content in thoracic aorta. (c) Vessel area stained by von Kossa in aortic arch. (d) Vascular calcification score calculation was implemented, as described in the Materials and Methods section. (e) Correlations were performed between the vascular calcification score and pulse pressure in rats from SNX 0.1 and SNX 0.4 groups. (f) mRNA expression was analyzed for genes involved in vascular calcification promotion. (g) mRNA expression for α-SMA, and genes associated with vascular calcification inhibition. Bar graphs represent mean ± SEM and p-value from Tukey’s multiple comparison test are indicated; ***: p < 0.001, **: p < 0.01, *: p < 0.05. Abbreviations: AA: aortic arch, Alpl: alkaline phosphatase, Bmp2: one morphogenetic protein 2, Enpp1: Ectonucleotide pyrophosphatase/phosphodiesterase 1, Mgp: Matrix Gla protein, Mmp2: matrix metalloproteinases 2, Msx2: Msh homeobox 2, Opn: osteopontin, Pit-1: Solute Carrier Family 20 Member 1, Pit-2: Solute Carrier Family 20 Member 2, Runx2: RUNX family transcription factor 2, SNX: subtotal nephrectomy, TA: thoracic aorta, VC: vascular calcification, α-SMA: Alpha smooth muscle actin.
Figure 2
Figure 2
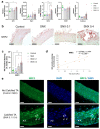
Changes in mRNA and protein expression in markers of cellular senescence and SASP in thoracic aorta of uremic rats. (a) mRNA expression of p16Ink4a, p21Cip1 and p53, markers of cell senescence, in thoracic aorta. (b) mRNA expression of pro-inflammatory cytokines contributing to the Senescence Associated Secretory Phenotype (SASP). (c) Representative images of immunohistochemistry staining of p16Ink4a and p21Cip1 in thoracic aorta. (d) Quantification of p16Ink4a and p21Cip1 IHC staining. (e) Correlation of p16Ink4a and p21Cip1 IHC staining with VC score. Bar graphs represent mean ± SEM and p-value from Tukey’s multiple comparison test are indicated; ***: p < 0.001, **: p < 0.01, *: p < 0.05. Scale bars correspond to 100 µm. Abbreviations: IHC: immunohistochemistry, IL-1ß: Interleukin 1 beta, IL-6: Interleukin 6, MCP-1: Monocyte Chemoattractant Protein-1, TA: thoracic aorta, VC: vascular calcification.
Figure 3
Figure 3
Immunofluorescence of γ-H2AX and co-labeling of γ-H2AX and p16Ink4a in calcified thoracic aortas of uremic rats. (a) Representative images of immunofluorescence labeling of γ-H2AX in thoracic aorta of uremic rats and controls. White arrows indicate nuclei with γ-H2AX labeling. The calcified area is highlighted in white. (b) Quantification of γ-H2AX-positive cells using immunofluorescence in thoracic aorta sections. (c) Correlation between γ-H2AX-positive cells and VC score in SNX 0.1 and SNX 0.4 rats. (d) Representative image of p16Ink4a and γ-H2AX co-labeling (white arrows) in calcified thoracic aortas. Bar graph represents mean ± SEM and p-value from Tukey’s multiple comparison test are indicated; ***: p < 0.001, **: p < 0.01. Scale bars = 50 µm. Abbreviations: SNX: subtotal nephrectomy, TA: thoracic aorta, VC: vascular calcification, γ-H2AX: serine 139 phosphorylated H2A histone family member X.
Figure 4
Figure 4
Changes in mRNA and protein expression of NRF2 and associated downstream targets in thoracic aorta of uremic rats. (a) mRNA expression of Nrf2 and downstream targets Nqo1, Sod1, GPx4 and Catalase in TA. (b) Representative images of NRF2 IHC staining in TA. Black scale bar represents 100 µm. (c) Quantification of NRF2 IHC staining in the media of TA. (d) Correlation between NRF2 IHC staining and VC score in SNX 0.1 and SNX 0.4 groups. (e) Representative images of NRF2 IF labeling in nuclei (white arrows) close to calcium deposits in calcified TA. Labeling was absent in thoracic aorta without calcification (control and SNX groups). White scale bar represents 50 µm. Bar graphs represent mean ± SEM and p-value from Tukey’s multiple comparison test are indicated; ***: p < 0.001, **: p < 0.01, *: p < 0.05. Abbreviations: GPx4: Glutathione peroxidase 4, IF: immunofluorescence, IHC: immunohistochemistry, Nqo1: NAD(P)H quinone dehydrogenase 1, NRF2: nuclear factor erythroid 2-related factor 2, SNX: subtotal nephrectomy, TA: thoracic aorta, Sod1: superoxide dismutase type 1.
Figure 5
Figure 5
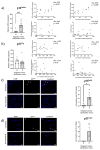
Increased senescent cell burden is associated with presence of calcification in epigastric arteries from kidney failure patients. p16Ink4a and p21Cip1 expression, two markers of senescence, were assessed in severely calcified (scored 3) and non-calcified (scored 0) epigastric arteries isolated from kidney failure patients at LD-Ktx. (a) p16Ink4a mRNA expression in epigastric arteries (n = 8 per group). Relative gene expression normalized to non-calcified group. p16Ink4a expression was also correlated with ALPL, RUNX2, epigastric artery calcification as a % and hsCRP. (b) p21Cip1 mRNA expression in epigastric arteries (n = 8 per group). Relative gene expression normalized to non-calcified group. p21Cip1 expression was also correlated with ALPL, RUNX2, epigastric artery calcification as a % and hsCRP. (c) Representative IF images of p16Ink4a labeling in calcified and non-calcified arteries. p16-positive cells are denoted with a white triangle. Quantification of p16Ink4a protein expression in non-calcified (0) and severely calcified groups (3) is also shown. N = 4–5 per group depending on individual vessel integrity after sectioning. Data presented as number of p16Ink4a -positive cells as a % of total number of cells in the media layer of vessels. White scale bar represents 20 µm. (d) Representative IF images of p21Cip1 labeling in calcified and non-calcified arteries taken from kidney failure patients. p21Cip1-positive cells are denoted with a white triangle. Quantification of p21Cip1 protein expression in non-calcified (0) and severely calcified groups (3) also shown. N = 4–5 per group depending on individual vessel integrity after sectioning. Data presented as number of p21Cip1-positive cells as a % of total number of cells in the tunica media layer of vessels. White scale bar represents 10 µm. Statistics: Spearman rank correlation coefficient is given for non-parametric data. Normality was assessed with Shapiro–Wilk test. Group comparisons were performed using independent t-test for normally distributed data or Mann–Whitney test for non-parametric data. p-values < 0.05 were deemed statistically significant. * indicates p < 0.05, *** indicates p < 0.001. Abbreviations: ALPL: alkaline phosphatase, hsCRP: high-sensitivity C-reactive protein, IF: immunofluorescence, LD-Ktx: living-donor kidney transplantation, RUNX2: RUNX family transcription factor 2.
Figure 6
Figure 6
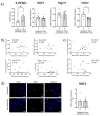
Preserved NRF2 expression between non-calcified and calcified epigastric arteries from renal failure patients. NRF2 expression was assessed in severely calcified (score 3) and non-calcified (score 0) epigastric arteries taken from kidney failure patients at LD-Ktx. (a) 8-OHdG measurement, and NRF2, NQO1 and SOD1 mRNA expression in epigastric arteries (n = 8 per group). Relative mRNA expression normalized to non-calcified group. (b) NRF2 mRNA expression correlated with ALPL mRNA expression, RUNX2 mRNA expression, epigastric artery % calcification and hsCRP. (c) NRF2 mRNA expression correlated with p16Ink4a and p21Cip1 mRNA expression. (d) Representative NRF2 IF images in calcified and non-calcified arteries. NRF2-positive cells are denoted with a white triangle. Quantification of NRF2 protein expression in non-calcified (0) and severely calcified groups (3) is also shown. White scale bars represent 20 µm. N = 4–5 per group depending on individual vessel structure, expressed as NRF2-positive area as a % of total area of media layer. Statistics: Spearman rank correlation coefficient is given for non-parametric data. Normality assessed with Shapiro–Wilk test. Differences between two groups assessed using unpaired t-test or Mann–Whitney test. p-values < 0.05 were deemed statistically significant; * indicates p < 0.05. Abbreviations: 8-OHdG: 8-hydroxydeoxyguanosine, ALPL: alkaline phosphatase, hsCRP: high-sensitivity C-reactive protein, LD-Ktx: living-donor kidney transplantation, NQO1: NAD(P)H quinone dehydrogenase 1, NRF2: nuclear factor erythroid 2-related factor 2, RUNX2: RUNX family transcription factor 2, SOD1: superoxide dismutase type 1.
Figure 7
Figure 7
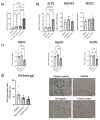
Uremic serum-induced aortic VSMC calcification is associated with dysregulated NRF2, while senescence remains unchanged. Aortic VSMCs were incubated with pooled uremic serum from severely calcified kidney failure patients (n = 8) for 7 days to induce calcification in vitro. Treatment conditions: control DMEM media (DMEM), 2.5 mM phosphate media (high phosphate), 10% pooled non-CKD serum + high phosphate media (non-CKD control serum) or 10% pooled uremic serum + high phosphate media (uremic serum). (a) Calcification assay using BoneTag Optical Dye, normalized for protein content (n = 4 per condition). (b) mRNA expression analysis of osteogenic markers RUNX2, ALPL, and MSX2 (n = 4 per condition). Relative mRNA expression normalized to DMEM control group. (c) Gene expression analysis of NRF2 and downstream genes SOD1 and NQO1 (n = 4 per condition), normalized to DMEM control group. (d) Quantification and representative images of SA-beta-gal-positive cells (denoted with a white triangle) when incubated with DMEM, osteogenic media or pooled uremic serum + osteogenic media. White scale bar represents 20 µm. Statistics: Groups were compared using one-way ANOVA followed by group-wise comparisons using Tukey’s post hoc test. p-values < 0.05 were deemed statistically significant. * indicates p < 0.05, ** indicates p < 0.01, **** indicates p < 0.0001. Abbreviations: ALPL: alkaline phosphatase, Msx2: Msh homeobox 2, NQO1: NQO1: NAD(P)H quinone dehydrogenase 1, NRF2: nuclear factor erythroid 2-related factor 2, RUNX2: RUNX family transcription factor 2, SA-beta-gal: senescence-associated beta-galactosidase, Sod1: superoxide dismutase type 1, VSMC: vascular smooth muscle cell.

References

    1. Cockwell P., Fisher L.A. The global burden of chronic kidney disease. Lancet. 2020;395:662–664. doi: 10.1016/S0140-6736(19)32977-0. - DOI - PubMed
    1. Kovesdy C.P. Epidemiology of chronic kidney disease: An update 2022. Kidney Int. Suppl. 2022;12:7–11. doi: 10.1016/j.kisu.2021.11.003. - DOI - PMC - PubMed
    1. 3. Bikbov B., Purcell C.A., Levey A.S., Smith M., Abdoli A., Abebe M., Adebayo O.M., Afarideh M., Agarwal S.K., Agudelo-Botero M., et al. Global, regional, and national burden of chronic kidney disease, 1990–2017: A systematic analysis for the Global Burden of Disease Study 2017. Lancet. 2020;395:709–733. doi: 10.1016/S0140-6736(20)30045-3. - DOI - PMC - PubMed
    1. Jankowski J., Floege J., Fliser D., Böhm M., Marx N. Cardiovascular Disease in Chronic Kidney Disease. Circulation. 2021;143:1157–1172. doi: 10.1161/CIRCULATIONAHA.120.050686. - DOI - PMC - PubMed
    1. Chen J., Budoff M.J., Reilly M., Yang W., Rosas S.E., Rahman M., Zhang X., Roy J.A., Lustigova E., Nessel L., et al. Coronary Artery Calcification and Risk of Cardiovascular Disease and Death Among Patients With Chronic Kidney Disease. JAMA Cardiol. 2017;2:635–643. doi: 10.1001/jamacardio.2017.0363. - DOI - PMC - PubMed

Publication types

MeSH terms

Substances