. 2023 Feb 8;15(4):1086.
doi: 10.3390/cancers15041086.

Drug Resistance in Medulloblastoma Is Driven by YB-1, ABCB1 and a Seven-Gene Drug Signature

Affiliations

Drug Resistance in Medulloblastoma Is Driven by YB-1, ABCB1 and a Seven-Gene Drug Signature

Louisa Taylor et al. Cancers (Basel). .

Abstract

Therapy resistance represents an unmet challenge in the treatment of medulloblastoma. Accordingly, the identification of targets that mark drug-resistant cell populations, or drive the proliferation of resistant cells, may improve treatment strategies. To address this, we undertook a targeted approach focused on the multi-functional transcription factor YB-1. Genetic knockdown of YB-1 in Group 3 medulloblastoma cell lines diminished cell invasion in 3D in vitro assays and increased sensitivity to standard-of-care chemotherapeutic vincristine and anti-cancer agents panobinostat and JQ1. For vincristine, this occurred in part by YB-1-mediated transcriptional regulation of multi-drug resistance gene ABCB1, as determined by chromatin immunoprecipitation. Whole transcriptome sequencing of YB-1 knockdown cells identified a role for YB-1 in the regulation of tumourigenic processes, including lipid metabolism, cell death and survival and MYC and mTOR pathways. Stable cisplatin- and vincristine-tolerant Group 3 and SHH cell lines were generated to identify additional mechanisms driving resistance to standard-of-care medulloblastoma therapy. Next-generation sequencing revealed a vastly different transcriptomic landscape following chronic drug exposure, including a drug-tolerant seven-gene expression signature, common to all sequenced drug-tolerant cell lines, representing therapeutically targetable genes implicated in the acquisition of drug tolerance. Our findings provide significant insight into mechanisms and genes underlying therapy resistance in medulloblastoma.

Keywords: ABC transporter; YB-1; cancer cell invasion; drug resistance; medulloblastoma; metastasis; vincristine.


Conflict of interest statement

The authors declare no conflict of interest. The funders had no role in the design of the study; in the collection, analyses, or interpretation of data; in the writing of the manuscript; or in the decision to publish the results.

Figures
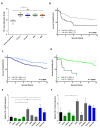
Figure 1
Figure 1
YB-1 is expressed highly in medulloblastoma and is associated with poor prognosis. (A) YB-1 gene expression is elevated in all four medulloblastoma principal groups. Normal cerebellum n = 9; MBGroup3 n = 56, MBGroup4 n = 91, MBSHH n = 59 and MBWNT n = 17. Expression displayed as box plots showing the sample minimum (lower line), lower quartile (bottom of box), median (line within box), upper quartile (top of box) and the sample maximum (upper line). (BD) Kaplan-Meier analysis revealed high YB-1 expression is associated with poor 10-year overall survival in MBGroup3 ((B); n = 144), MBGroup4 ((C); n = 326) and MBSHH ((D); n = 223) patients. Survival curves were compared using the Log-rank (Mantel-Cox) test. (E) Analysis of YB-1 mRNA expression by qRT-PCR revealed YB-1 expression across all available medulloblastoma cell lines. Gene expression was calculated relative to housekeeping gene GAPDH (ΔCq). U87 cells were utilised as a positive control. (F) Densitometry analysis of YB-1 protein expression relative to GAPDH expression revealed that YB-1 was expressed in all medulloblastoma cell lines examined. Cell lines are colour-coded as MBSHH (green), MBGroup3 (grey) and MBGroup4 (blue). * p < 0.05, ** p < 0.01; **** p < 0.0001. Only comparisons where there was statistical significance are shown. All other pairwise comparisons are non-significant.
Figure 2
Figure 2
YB-1 knockdown inhibits Group 3 medulloblastoma cell invasion. (A) In HD-MB03 and D283 cells, YB-1 was significantly depleted using the Y_A shRNA construct at an MOI of 0.1. Relative YB-1 mRNA expression displayed as fold change (2−ΔΔCq) relative to the appropriate non-silencing control. n = 3; mean ± SEM. Significance was assessed by ordinary one-way ANOVA analysis with Sidak’s multiple comparison tests. (B) Western blot analysis and concurrent densitometry revealed YB-1 protein expression to be significantly depleted in the KD-HD-MB03 and KD-D283 lines. Densitometry data are presented relative to the GAPDH loading control and normalised to the appropriate non-silencing control cell line. n = 3; mean ± SEM; ** p < 0.01, *** p < 0.001, **** p < 0.0001. Significance was assessed by ordinary one-way ANOVA analysis with Sidak’s multiple comparisons tests. (C) A schematic representation of the transwell migration and invasion assays was utilised in this experiment. Medulloblastoma cells were seeded in serum-free media and migrated (uncoated insert) or invaded (laminin 1/collagen IV-coated insert) for 48 h, facilitated by an FBS gradient. (D) YB-1 depletion did not have a significant effect on the migratory capacity of either KD-HD-MB03 or KD-D283 compared to the appropriate non-silencing control cell line. (E) YB-1 depletion resulted in a significant reduction in the number of invading cells detected in both KD-HD-MB03 and KD-D283 compared to the appropriate non-silencing control cell line. Mean ± SEM plotted; n = 3; * p < 0.05, n.s. = not significant; significance assessed by unpaired t-test. (F) To assess the effect of YB-1 knockdown on proliferation, cell metabolic activity was assessed at 0, 24, 48 and 72 h time points using an end-point PrestoBlue cell viability assay. No difference in relative cell proliferation was detected between non-silencing and YB-1 knockdown cells in either cell line. n = 3 (HD-MB03); n = 5 (D283). Metabolic activity at each time point relative to metabolic activity at the 0 h time point was used to calculate relative cell proliferation. Mean ± SEM plotted. Significance was assessed by way of multiple t-tests with Holm-Sidak multiple comparisons testing. The uncropped blots are shown in Figure S5.
Figure 3
Figure 3
Whole transcriptome sequencing of YB-1 knockdown cell lines demonstrates roles for YB-1 in key cellular pathways in medulloblastoma cells. (A) Venn diagram displaying the number of significantly up-regulated genes following YB-1 knockdown in KD-HD-MB03 and KD-D283 lines, with the top 10 most significant genes highlighted. (B) Venn diagram displaying the number of significantly down-regulated genes following YB-1 knockdown in KD-HD-MB03 and KD-D283 lines, with the top 10 most significant genes highlighted. Genes were ordered based on Log2 fold change. Significance was determined using an uncorrected p-value (≤0.05) and an FDR p-value (≤0.1). p-Values were adjusted using the Benjamini-Hochberg False Discovery Rate (FDR) approach to correct for multiple testing. (C) The 5 most significantly dysregulated functions following YB-1 knockdown in HD-MB03 and D283 (D) cells. (E) Top significantly altered canonical pathways following YB-1 knockdown in HD-MB03 and D283 cells are displayed. Where possible, an activation Z-score was determined, red indicates an inhibitory effect while green indicates an activational effect. Grey bars represent pathways for which a Z-score could not be determined (n.d.). Significance was calculated using Fisher’s exact test. (F) Heatmap presenting results of Upstream Regulator Analysis. mTOR binding protein RICTOR was found to be significantly inhibited in KD- HD-MB03 cells (Z-score = −2.2), while MYC and mTOR binding protein RPTOR were found to be significantly inhibited in KD-D283 cells (Z-scores = −2.1 and −2.0 respectively).
Figure 4
Figure 4
YB-1 depletion alters medulloblastoma cell sensitivity to various anti-cancer therapies. KD/NS-D283 and KD/NS-HD-MB03 cells were treated with vincristine (0.1–100 nM), cisplatin (0.05–10 µM), JQ1 (0.025–50 µM) and panobinostat (0.1–100 nM) for 72 h, after which cell viability was assessed by PrestoBlue metabolic assays. (A) KD-HD-MB03 cells showed a significant reduction in cell viability compared to the NS-HD-MB03 control line in response to vincristine (0.5–1 nM), panobinostat (0.1–10 nM) and JQ1 (0.05, 0.1, 0.5, 1.0 and 5 µM) treatment). (B) KD-D283 cells showed a significant reduction in cell viability compared to the NS-D283 control line at 0.5 nM, 1 nM and 5 nM vincristine treatment. Grey boxes depict clinically achievable drug CSF concentrations. Mean ± SEM plotted; n = 4. Significance was assessed by way of Two-Way ANOVA with Sidak’s multiple comparison tests. (C) Schematic displaying the identified YB-1 binding site (B.S.) in the ABCB1 promoter region. The core inverted CCAAT pentanucleotide is highlighted in blue. (D) qPCR analysis of ChIP assay products revealed that YB-1 binds strongly to an inverted CCAAT box in the ABCB1 promoter of HD-MB03 and D283 cell lines. n = 3; data normalised to input; mean ± SEM plotted; significance assessed by paired t-test analysis. (E) ABCB1 expression in KD-D283 and KD-HD-MB03 cell lines was analysed by qRT-PCR and quantified relative to non-silencing controls (2−ΔΔCq). KD-HD-MB03 (n = 3) and KD-D283 cells (n = 5) exhibited a significant reduction in ABCB1 mRNA expression relative to NS-HD-MB03 and KD-D283. Mean ± SEM plotted; significance assessed by unpaired t-test. Significant differences indicated as * p < 0.05, ** p < 0.01, *** p < 0.001 and *** p < 0.0001.
Figure 5
Figure 5
3′mRNA-Seq of drug-tolerant medulloblastoma cell lines reveals a gene signature associated with cisplatin and vincristine resistance. (A) D458, D283 and HD-MB03 cell lines were cultured continuously in the presence of cisplatin. Cell viability assays (PrestoBlue) allowed monitoring of cellular resistance compared to a vehicle-treated control line and/or the parental line. DT-D458-CIS cells exhibited an 18.5-fold increase in IC50 value compared to the parental cell line following continuous treatment in 0.6 µM cisplatin. (B) DT-D283-CIS cells exhibited a 2.5-fold increase in IC50 value compared to the parental cell line following continuous treatment in 1.6 µM cisplatin. (C) DT-HD-MB03-CIS cells exhibited a 1.6-fold increase in IC50 value compared to the parental cell line following continuous treatment in 0.5 µM cisplatin. (D) DT-DAOY-VIN cells were cultured continuously in the presence of vincristine. Cells exhibited a 2.8-fold increase in IC50 value compared to the parental cell line following continuous treatment with 2 nM vincristine. Mean ± SEM plotted; n = 3. Dose-response curves were generated using non-linear regression analyses and IC50 values were calculated accordingly. The significance of IC50 values was assessed by ordinary one-way ANOVA analyses with Tukey’s multiple comparisons tests. (E) Significantly up-regulated genes and down-regulated genes (F) were detected in drug-tolerant cell lines compared to vehicle-treated control cell lines. Significantly up-/down-regulated genes were those found to be up-regulated in DT cell lines compared to vehicle-treated control lines, with a Log2 fold change of ≥+0.5/≤−0.5, a BH-adjusted p-value of ≤0.05 and expression of ≥2 normalised counts. 7 genes were identified as commonly up-regulated between all four DT cell lines. (G) MAP1A and MBNL2 (H) expression is elevated in medulloblastoma patient samples collected post-therapy compared to samples collected at diagnosis or relapse. Diagnosis n = 46; post-treatment n = 8, relapse n = 3. Expression is displayed as box plots showing the sample minimum (lower line) and the sample maximum (upper line). Dataset (Tumor Medulloblastoma public—Delattre—57—MAS5.0—u133p2) accessed using R2: Genomics Analysis and Visualization Platform. * p < 0.05, ** p < 0.01, *** p < 0.001, **** p < 0.0001.

References

    1. Sharma T., Schwalbe E., Williamson D., Sill M., Hovestadt V., Mynarek M., Rutkowski S., Robinson G., Gajjar A., Cavalli F., et al. Second-generation molecular subgrouping of medulloblastoma: An international meta-analysis of Group 3 and Group 4 subtypes. Acta Neuropathol. 2019;138:309–326. doi: 10.1007/s00401-019-02020-0. - DOI - PMC - PubMed
    1. Taylor M., Northcott P., Korshunov A., Remke M., Cho Y.-J., Clifford S., Eberhart C., Parsons W., Rutkowski S., Gajjar A., et al. Molecular subgroups of medulloblastoma: The current consensus. Acta Neuropathol. 2012;123:465–472. doi: 10.1007/s00401-011-0922-z. - DOI - PMC - PubMed
    1. Hill R.M., Richardson S., Schwalbe E.C., Hicks D., Lindsey J.C., Crosier S., Rafiee G., Grabovska Y., Wharton S.B., Jacques T.S., et al. Time, pattern, and outcome of medulloblastoma relapse and their association with tumour biology at diagnosis and therapy: A multicentre cohort study. Lancet Child Adolesc. Health. 2020;4:865–874. doi: 10.1016/S2352-4642(20)30246-7. - DOI - PMC - PubMed
    1. Bertrand K.C., Faria C.C., Skowron P., Luck A., Garzia L., Wu X., Agnihotri S., Smith C.A., Taylor M.D., Mack S.C., et al. A functional genomics approach to identify pathways of drug resistance in medulloblastoma. Acta Neuropathol. Commun. 2018;6:146. doi: 10.1186/s40478-018-0652-8. - DOI - PMC - PubMed
    1. Eliseeva I.A., Kim E.R., Guryanov S.G., Ovchinnikov L.P., Lyabin D.N. Y-box-binding protein 1 (YB-1) and its functions. Biochemistry. 2011;76:1402–1433. doi: 10.1134/S0006297911130049. - DOI - PubMed

LinkOut - more resources