Direct Cell Death Induced by CD20 Monoclonal Antibodies on B Cell Lymphoma Cells Revealed by New Protocols of Analysis
- PMID: 36831451
- PMCID: PMC9954594
- DOI: 10.3390/cancers15041109
Direct Cell Death Induced by CD20 Monoclonal Antibodies on B Cell Lymphoma Cells Revealed by New Protocols of Analysis
Abstract
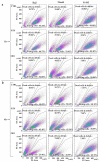
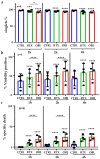
CD20 monoclonal antibodies (mAbs) eliminate B cells in several clinical contexts. At least two of these Abs, obinutuzumab (OBI) and rituximab (RTX), induce quick elimination of targets and put cancer patients at risk of tumor lysis syndrome (TLS) within 12-24 h of the first dose. The mechanisms of killing can require the recruiting of effector mechanisms from the patient's immune system, but they can induce direct killing as well. This can be more rapid than recruiting cellular effectors and/or complement. We showed here that OBI and RTX induce quick (<1 h) and high (up to 60% for OBI) killing of two different B cell lines. This was unveiled by using two different techniques that circumvent cell centrifugation steps: a Muse® Cell Analyzer-based approach and a direct examination of the cells' physical properties by using forward scatter (FS) area and side scatter (SS) area by flow cytometry. These results excluded the presence of aggregates and were also confirmed by developing a normalized survival ratio based on the co-incubation of RTX- and OBI-sensitive cells with MOLM-13, an insensitive cell line. Finally, this normalized survival ratio protocol confirmed the RTX- and OBI-direct killing on primary tumor B cells from B cell chronic lymphocytic leukemia (B-CLL) and Non-Hodgkin's lymphoma (NHL) patients. Moreover, we unveiled that direct killing is higher than previously expected and absent in patients' samples at relapse. We also observed that these mAbs, prior to increasing intracellular calcium levels, decrease calcium entry, although manipulating calcium levels did not affect their cytotoxicity. Altogether, our results show that direct killing is a major mechanism to induce cell death by RTX and OBI mAbs.
Keywords: B cell lymphoma; CD20 mAbs; LLC; direct killing; obinutuzumab; rituximab.
Conflict of interest statement
The authors declare no conflict of interest.
Figures


Similar articles
-
Rituximab: a review of its use in non-Hodgkin's lymphoma and chronic lymphocytic leukaemia.Drugs. 2003;63(8):803-43. doi: 10.2165/00003495-200363080-00005. Drugs. 2003. PMID: 12662126 Review.
-
Complement-Dependent Activity of CD20-Specific IgG Correlates With Bivalent Antigen Binding and C1q Binding Strength.Front Immunol. 2021 Jan 11;11:609941. doi: 10.3389/fimmu.2020.609941. eCollection 2020. Front Immunol. 2021. PMID: 33505398 Free PMC article.
-
The selection of variable regions affects effector mechanisms of IgA antibodies against CD20.Blood Adv. 2021 Oct 12;5(19):3807-3820. doi: 10.1182/bloodadvances.2021004598. Blood Adv. 2021. PMID: 34525171 Free PMC article.
-
Near-infrared fluorescence imaging of non-Hodgkin's lymphoma CD20 expression using Cy7-conjugated obinutuzumab.Mol Imaging Biol. 2014 Dec;16(6):877-87. doi: 10.1007/s11307-014-0742-3. Mol Imaging Biol. 2014. PMID: 24833041
-
Obinutuzumab in hematologic malignancies: lessons learned to date.Cancer Treat Rev. 2015 Nov;41(9):784-92. doi: 10.1016/j.ctrv.2015.07.003. Epub 2015 Jul 14. Cancer Treat Rev. 2015. PMID: 26190254 Review.
Cited by
-
Anti-CD19/CD20 bispecific antibody with dual Fc domains mediates enhanced effector functions and durable depletion of memory B cells in vivo.Sci Rep. 2025 Aug 27;15(1):31563. doi: 10.1038/s41598-025-16461-z. Sci Rep. 2025. PMID: 40866422 Free PMC article.
-
METTL3-mediated m6A methylation of C1qA regulates the Rituximab resistance of diffuse large B-cell lymphoma cells.Cell Death Discov. 2023 Nov 1;9(1):405. doi: 10.1038/s41420-023-01698-2. Cell Death Discov. 2023. PMID: 37907575 Free PMC article.
-
Tumor Lysis Syndrome with CD20 Monoclonal Antibodies for Chronic Lymphocytic Leukemia: Signals from the FDA Adverse Event Reporting System.Clin Drug Investig. 2023 Oct;43(10):773-783. doi: 10.1007/s40261-023-01308-0. Epub 2023 Sep 27. Clin Drug Investig. 2023. PMID: 37755660
-
The Arming of Natural Killer Cells With Fc-Engineered Monoclonal Antibodies Confers Specificity Against Tumor B Cells.MedComm (2020). 2025 Jul 4;6(7):e70242. doi: 10.1002/mco2.70242. eCollection 2025 Jul. MedComm (2020). 2025. PMID: 40626322 Free PMC article. No abstract available.
References
-
- Ivanov A., Beers S.A., Walshe C.A., Honeychurch J., Alduaij W., Cox K.L., Potter K.N., Murray S., Chan C.H., Klymenko T., et al. Monoclonal antibodies directed to CD20 and HLA-DR can elicit homotypic adhesion followed by lyso-some-mediated cell death in human lymphoma and leukemia cells. J. Clin. Investig. 2009;119:2143–2159. - PMC - PubMed
-
- Rubenstein J.L., Fridlyand J., Abrey L., Shen A., Karch J., Wang E., Issa S., Damon L., Prados M., McDermott M., et al. Phase I study of intraventricular administration of rituximab in patients with recurrent CNS and in-traocular lymphoma. J. Clin. Oncol. Off. J. Am. Soc. Clin. Oncol. 2007;25:1350–1356. doi: 10.1200/JCO.2006.09.7311. - DOI - PubMed
Grants and funding
LinkOut - more resources
Full Text Sources

