. 2023 Feb 13;15(4):1184.
doi: 10.3390/cancers15041184.

CD39-Expressing CD8+ T Cells as a New Molecular Marker for Diagnosis and Prognosis of Esophageal Squamous Cell Carcinoma

Affiliations

CD39-Expressing CD8+ T Cells as a New Molecular Marker for Diagnosis and Prognosis of Esophageal Squamous Cell Carcinoma

Meitong Liu et al. Cancers (Basel). .

Abstract

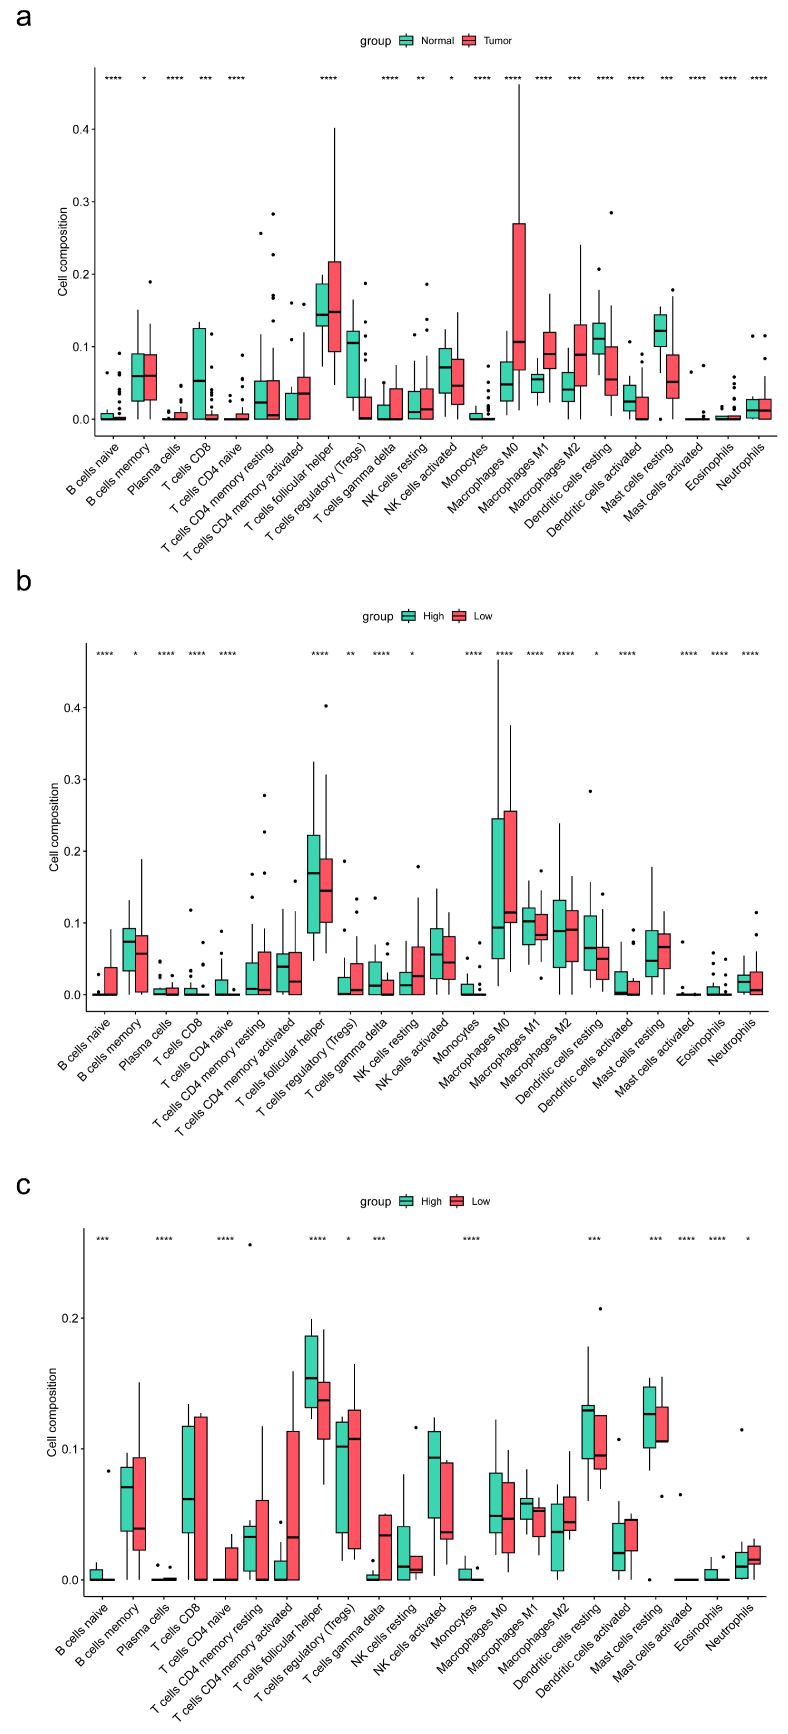
We aimed to explore the effect of CD39 expression on CD8+ T cells and on the diagnosis and prognosis of esophageal squamous cell carcinoma (ESCC). The independent prognostic factors for the surgical specimens of the 95 ESCC patients were screened by multivariate Cox regression analysis. Differential gene expression analysis was performed by the NetworkAnalyst platform based on data from the Gene Expression Omnibus (GEO). The expression of CD39 on CD8+ T cells in the CK+ region was higher in cancer tissue than in paracancerous tissue (p = 0.011), and high CD39-expressing CD8+ T cells in the CK+ region (HR, 2.587; p = 0.033) and high CD39-expressing CD8+ T cells in the CK- region (HR, 3.090; p = 0.008) were independent risk factors for prognosis in ESCC patients; the expression of ENTPD1 was upregulated in ESCC tissues compared to normal tissues (adjusted p < 0.001; log2 fold change = 1.99), and its expression was significantly positively correlated with the expression of PDCD1, CTLA4, and HAVCR2. High CD39-expressing CD8+ T cells can be used as a new molecular marker for the diagnosis and prognosis of ESCC, and the restoration of partially exhausted CD8+ T cells by inhibiting CD39 may be a new strategy for treating ESCC.

Keywords: CD39+CD8+ T cells; diagnosis; esophageal squamous cell carcinoma; nomogram; prognosis; tumor microenvironment.


Conflict of interest statement

The authors declare no conflict of interest.

Figures

Figure 1
Figure 1
The difference of CD39 expression in 71 pairs of ESCC cancer tissues and paracancerous tissues. (ac) The differences of CD39+ count, CD8+ count, and CD39-expressing CD8+ T cells between ESCC cancer tissues and paracancerous tissues; (df) The differences of CD39+ in CK+ region, CD39+ in CK region, and CD8+ in CK+ region between ESCC cancer tissues and paracancerous tissues; (gi) The differences of CD8+ in CK region, CD39-expressing CD8+ T cells in CK+ region, and CD39-expressing CD8+ T cells in CK region between ESCC cancer tissues and paracancerous tissues. CD39, ectonucleoside triphosphate diphosphohydrolase 1; CK, cytokeratin; ESCC, esophageal squamous cell carcinoma; IQR, interquartile range; SD, standard deviation. The error bar represents median and interquartile range (IQR) in (a,b,dg). The error bar represents mean and standard deviation (SD) in (c,h,i). * p < 0.05, ** p < 0.01, *** p < 0.001.
Figure 2
Figure 2
Survival curve analysis of prognostic variables with statistically significant differences. (ad) Survival curve analyses of gender, proportion of positive lymph nodes, pathological grade, and T stage; (eg) Survival curve analyses of TNM stage, CD39+ in CK+ region, and CD39-expressing CD8+ T cells in CK+ region. CD39, ectonucleoside triphosphate diphosphohydrolase 1; CK, cytokeratin; OS, overall survival. * p < 0.05, ** p < 0.01.
Figure 3
Figure 3
Hazard ratio of ESCC in the training group and nomogram model for OS of ESCC. (a) Hazard ratio of ESCC in the training group; (b) Nomogram model for OS of ESCC. CD39, ectonucleoside triphosphate diphosphohydrolase 1; CI, confidence interval; CK, cytokeratin; ESCC, esophageal squamous cell carcinoma; HR, hazard ratio; OS, overall survival. * p < 0.05, ** p < 0.01.
Figure 4
Figure 4
The AUCs at 1, 3, and 5 years of nomogram model and other independent prognostic factors of ESCC. (a) The 1-year AUCs of nomogram model and other independent prognostic factors of ESCC; (b) The 3-year AUCs of nomogram model and other independent prognostic factors of ESCC; (c) The 5-year AUCs of nomogram model and other independent prognostic factors of ESCC. AUC, area under the curve of receiver operating characteristics (ROC); CD39, ectonucleoside triphosphate diphosphohydrolase 1; CK, cytokeratin; ESCC, esophageal squamous cell carcinoma.
Figure 5
Figure 5
The validations of nomogram model and risk stratification of ESCC. (a,d) The AUCs at 1, 3, and 5 years of the training group and validation group; (b,e) The calibration curves at 1, 3, and 5 years of the training group and validation group; (c,f) The DCAs of the training group and validation group; (g) Survival curve analysis of risk stratification; (h) The AUCs at 1, 3, and 5 years of risk stratification in the training group. AUC, area under the curve of receiver operating characteristics (ROC); DCA, decision curve analysis; ESCC, esophageal squamous cell carcinoma; OS, overall survival. *** p < 0.001.
Figure 6
Figure 6
Volcano plot of differential gene expression analysis and heatmap of infiltration abundance of 22 immune cells. (a) Volcano plot of differential gene expression analysis of 41 ESCC and 12 normal tissues samples; (b) Heatmap of infiltration abundance of 22 immune cells of 41 ESCC and 12 normal tissues samples. ENTPD1, ectonucleoside triphosphate diphosphohydrolase 1.
Figure 7
Figure 7
Box plots of the differences in the infiltration abundance of 22 immune cells between ESCC and normal samples and between high and low ENTPD1-expresing groups. (a) Box plot of the differences in the infiltration abundance of 22 immune cells between ESCC and normal samples; (b) Box plot of the differences in the infiltration abundance of 22 immune cells between high and low ENTPD1-expresing groups in ESCC samples; (c) Box plot of the differences in the infiltration abundance of 22 immune cells between high and low ENTPD1-expresing groups in normal samples. ENTPD1, ectonucleoside triphosphate diphosphohydrolase 1; ESCC, esophageal squamous cell carcinoma. * p < 0.05, ** p < 0.01, *** p < 0.001, **** p < 0.0001.

References

    1. Sung H., Ferlay J., Siegel R.L., Laversanne M., Soerjomataram I., Jemal A., Bray F. Global Cancer Statistics 2020: GLOBOCAN Estimates of Incidence and Mortality Worldwide for 36 Cancers in 185 Countries. CA A Cancer J. Clin. 2021;71:209–249. doi: 10.3322/caac.21660. - DOI - PubMed
    1. Pennathur A., Gibson M.K., Jobe B.A., Luketich J.D. Oesophageal carcinoma. Lancet. 2013;381:400–412. doi: 10.1016/S0140-6736(12)60643-6. - DOI - PubMed
    1. Yang R., Elsaadi S., Misund K., Abdollahi P., Vandsemb E.N., Moen S.H., Kusnierczyk A., Slupphaug G., Standal T., Waage A., et al. Conversion of ATP to adenosine by CD39 and CD73 in multiple myeloma can be successfully targeted together with adenosine receptor A2A blockade. J. Immunother. Cancer. 2020;8:e000610. doi: 10.1136/jitc-2020-000610. - DOI - PMC - PubMed
    1. Allard B., Allard D., Buisseret L., Stagg J. The adenosine pathway in immuno-oncology. Nat. Rev. Clin. Oncol. 2020;17:611–629. doi: 10.1038/s41571-020-0382-2. - DOI - PubMed
    1. Tallón de Lara P., Castañón H., Vermeer M., Núñez N., Silina K., Sobottka B., Urdinez J., Cecconi V., Yagita H., Movahedian Attar F., et al. CD39(+)PD-1(+)CD8(+) T cells mediate metastatic dormancy in breast cancer. Nat. Commun. 2021;12:769. doi: 10.1038/s41467-021-21045-2. - DOI - PMC - PubMed