

Parkinson's Disease Gene Biomarkers Screened by the LASSO and SVM Algorithms
- PMID: 36831718
- PMCID: PMC9953979
- DOI: 10.3390/brainsci13020175
Parkinson's Disease Gene Biomarkers Screened by the LASSO and SVM Algorithms
Abstract
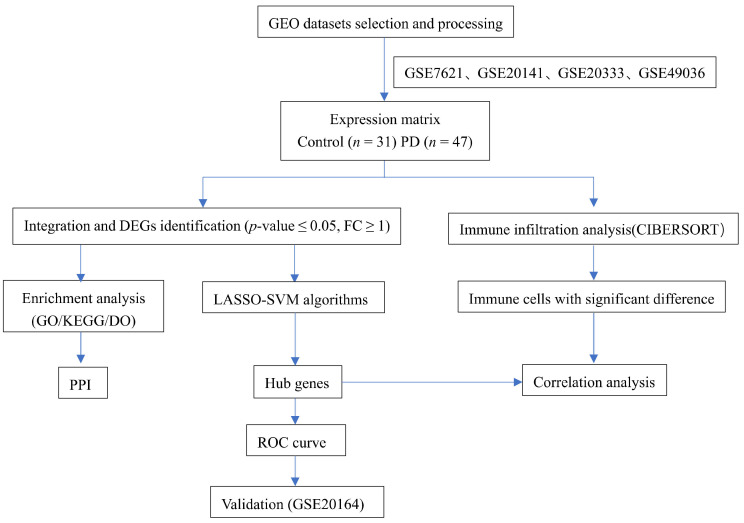
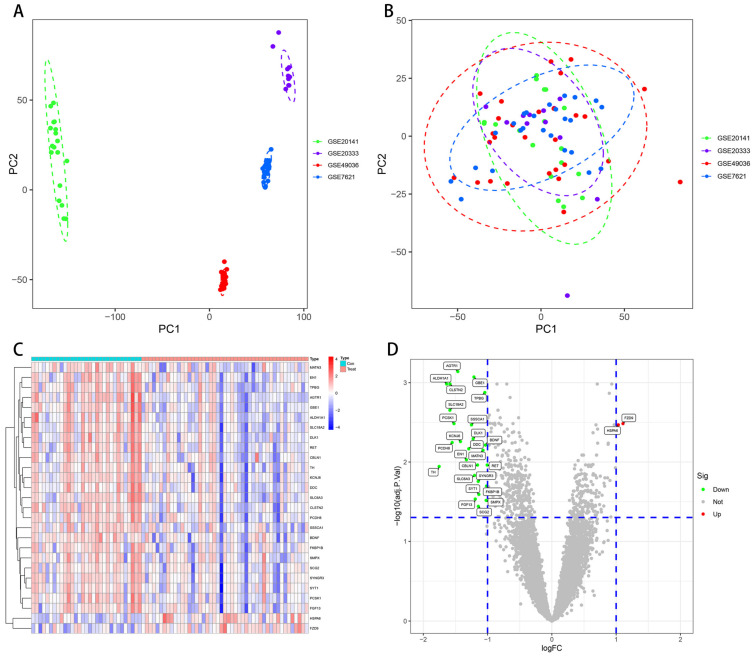
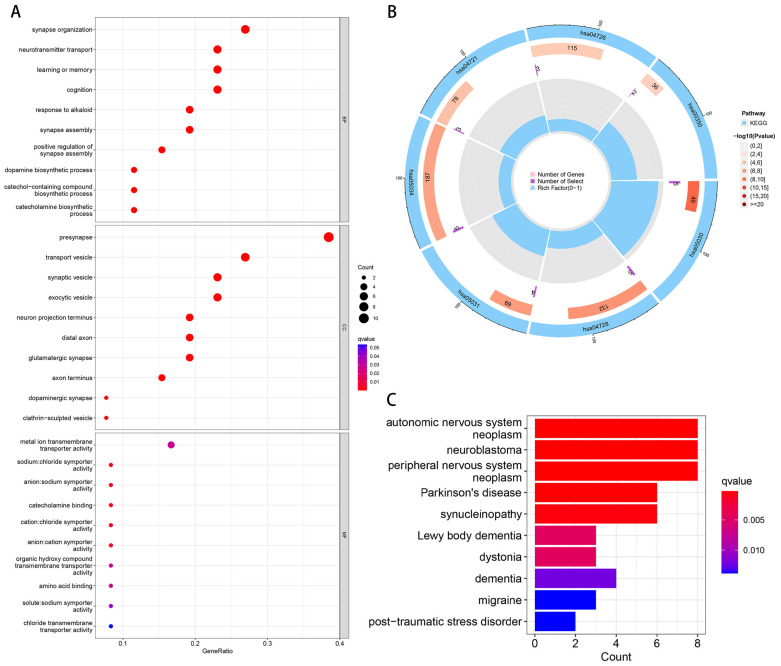
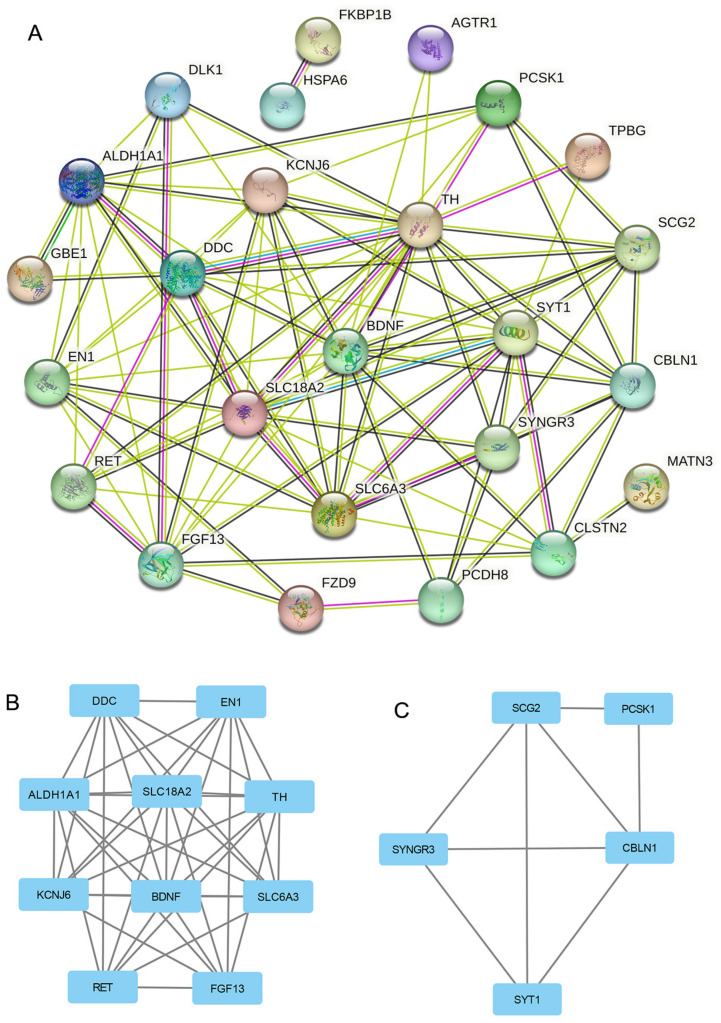
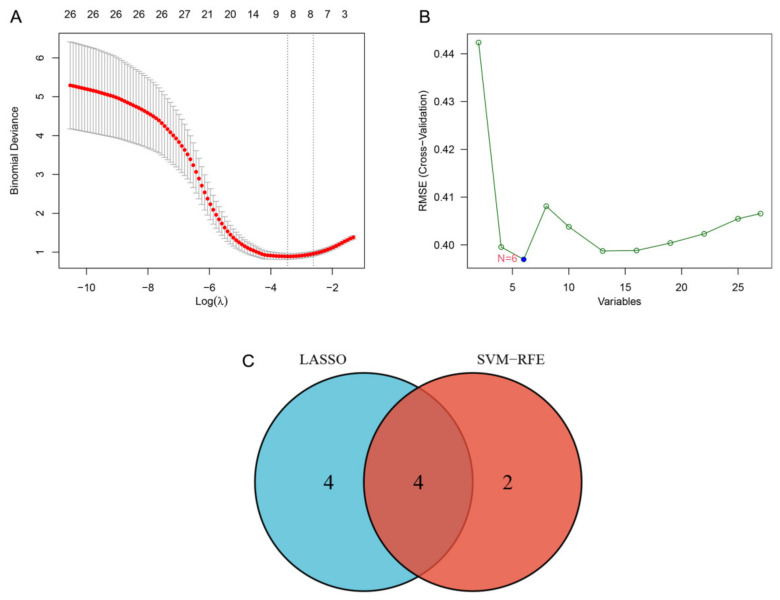
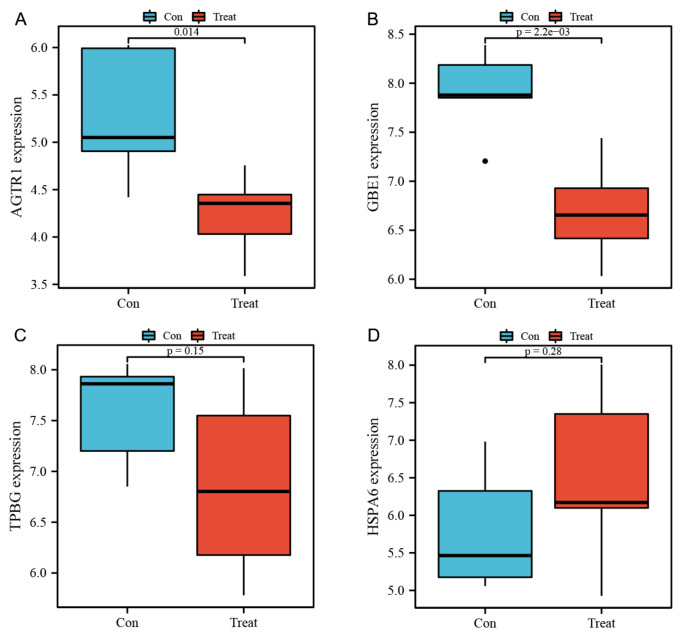
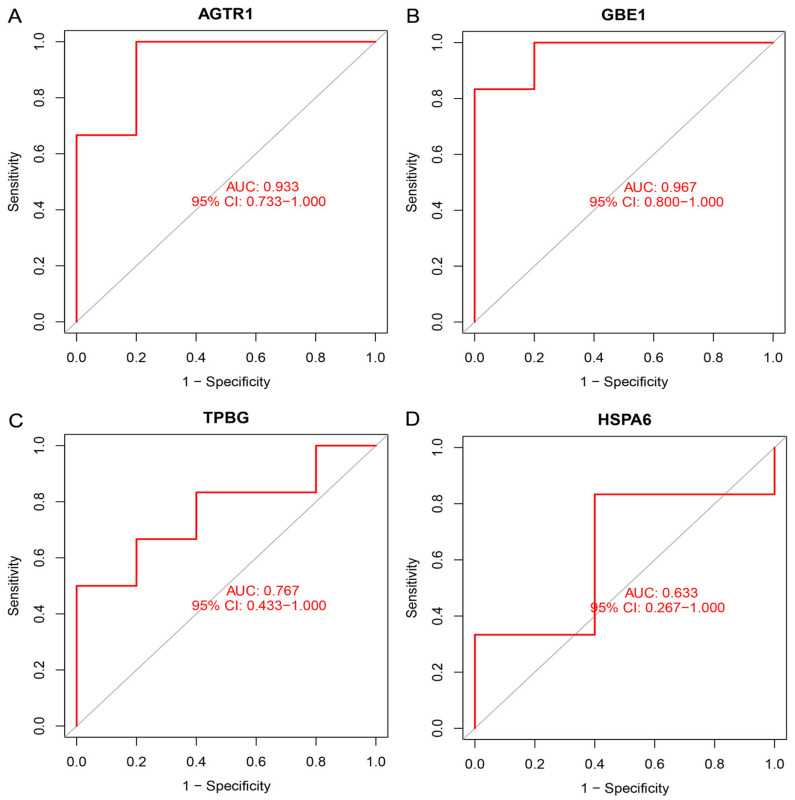
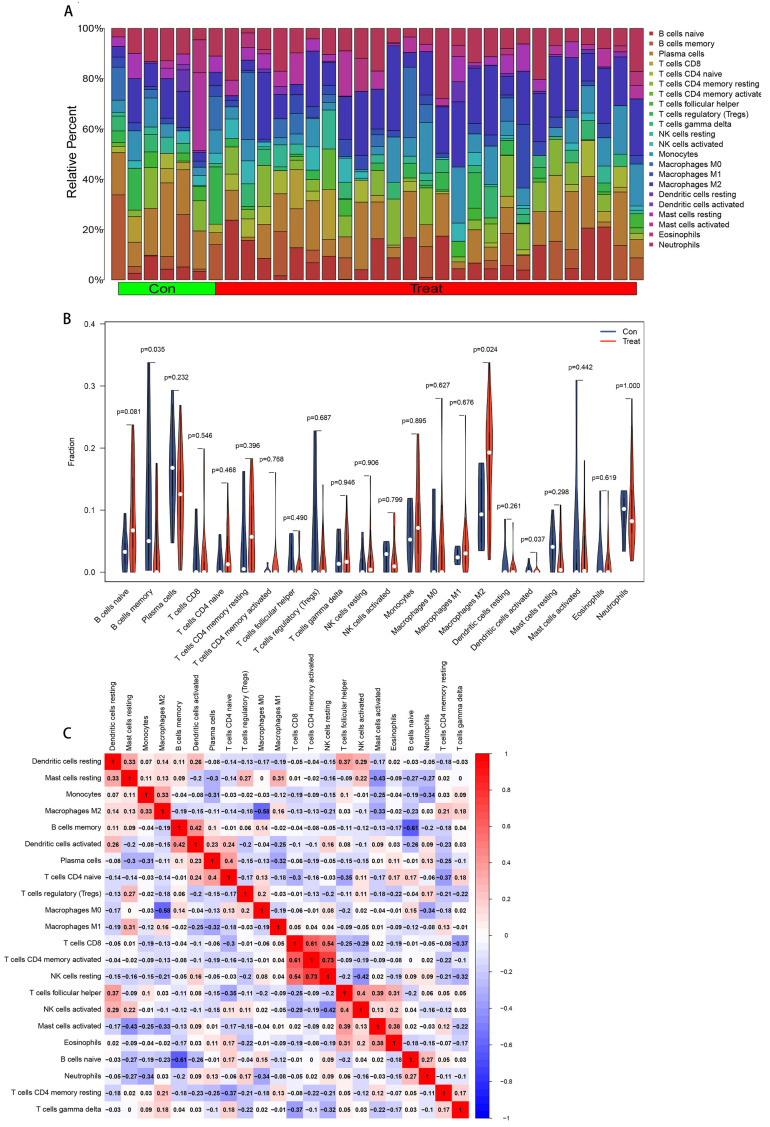
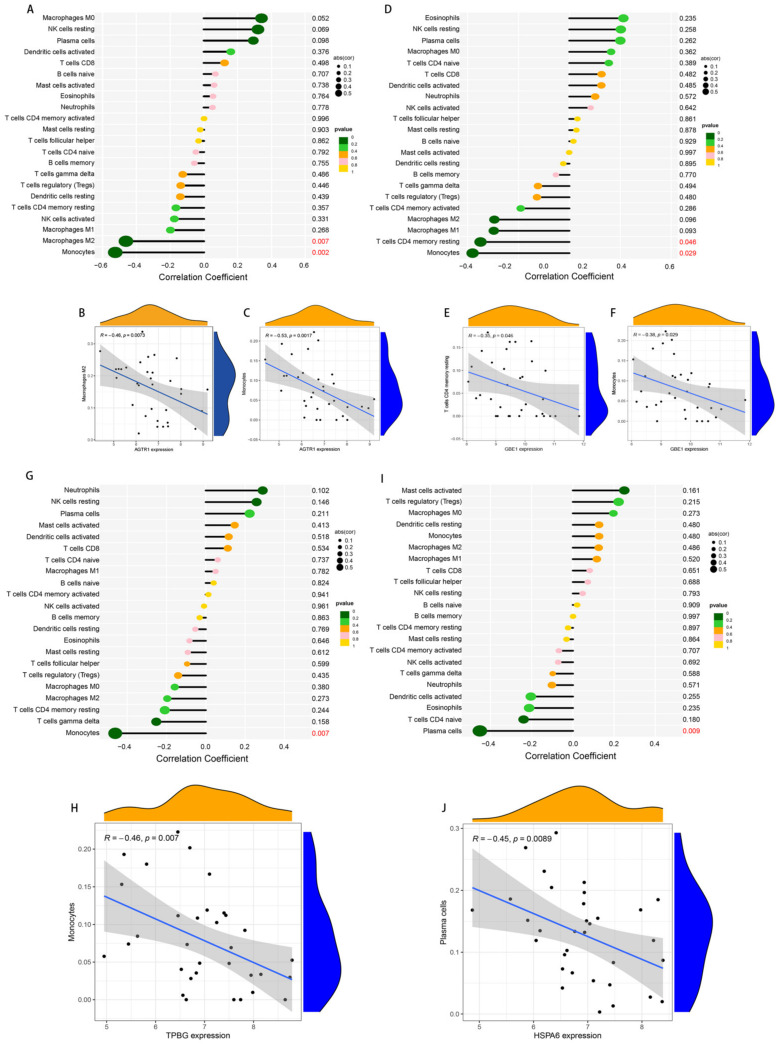
Parkinson's disease (PD) is a common progressive neurodegenerative disorder. Various evidence has revealed the possible penetration of peripheral immune cells in the substantia nigra, which may be essential for PD. Our study uses machine learning (ML) to screen for potential PD genetic biomarkers. Gene expression profiles were screened from the Gene Expression Omnibus (GEO). Differential expression genes (DEGs) were selected for the enrichment analysis. A protein-protein interaction (PPI) network was built with the STRING database (Search Tool for the Retrieval of Interacting Genes), and two ML approaches, namely least absolute shrinkage and selection operator (LASSO) and support vector machine recursive feature elimination (SVM-RFE), were employed to identify candidate genes. The external validation dataset further tested the expression degree and diagnostic value of candidate biomarkers. To assess the validity of the diagnosis, we determined the receiver operating characteristic (ROC) curve. A convolution tool was employed to evaluate the composition of immune cells by CIBERSORT, and we performed correlation analyses on the basis of the training dataset. Twenty-seven DEGs were screened in the PD and control samples. Our results from the enrichment analysis showed a close association with inflammatory and immune-associated diseases. Both the LASSO and SVM algorithms screened eight and six characteristic genes. AGTR1, GBE1, TPBG, and HSPA6 are overlapping hub genes strongly related to PD. Our results of the area under the ROC (AUC), including AGTR1 (AUC = 0.933), GBE1 (AUC = 0.967), TPBG (AUC = 0.767), and HSPA6 (AUC = 0.633), suggested that these genes have good diagnostic value, and these genes were significantly associated with the degree of immune cell infiltration. AGTR1, GBE1, TPBG, and HSPA6 were identified as potential biomarkers in the diagnosis of PD and provide a novel viewpoint for further study on PD immune mechanism and therapy.
Keywords: Parkinson’s disease; immune infiltrates; least absolute shrinkage and selection operator; support vector machine.
Conflict of interest statement
The authors declare no conflict of interest.
Figures
Similar articles
-
Renal tubular gen e biomarkers identification based on immune infiltrates in focal segmental glomerulosclerosis.Ren Fail. 2022 Dec;44(1):966-986. doi: 10.1080/0886022X.2022.2081579. Ren Fail. 2022. PMID: 35713363 Free PMC article.
-
Identifying the hub gene and immune infiltration of Parkinson's disease using bioinformatical methods.Brain Res. 2022 Jun 15;1785:147879. doi: 10.1016/j.brainres.2022.147879. Epub 2022 Mar 10. Brain Res. 2022. PMID: 35278479
-
Lasso algorithm and support vector machine strategy to screen pulmonary arterial hypertension gene diagnostic markers.Scott Med J. 2023 Feb;68(1):21-31. doi: 10.1177/00369330221132158. Epub 2022 Oct 17. Scott Med J. 2023. PMID: 36253715
-
Exploration of the shared diagnostic genes and mechanisms between periodontitis and primary Sjögren's syndrome by integrated comprehensive bioinformatics analysis and machine learning.Int Immunopharmacol. 2024 Nov 15;141:112899. doi: 10.1016/j.intimp.2024.112899. Epub 2024 Aug 13. Int Immunopharmacol. 2024. PMID: 39142001
-
Identification of biomarkers associated with pediatric asthma using machine learning algorithms: A review.Medicine (Baltimore). 2023 Nov 24;102(47):e36070. doi: 10.1097/MD.0000000000036070. Medicine (Baltimore). 2023. PMID: 38013370 Free PMC article. Review.
Cited by
-
A multimodal prediction model for suicidal attempter in major depressive disorder.PeerJ. 2023 Nov 8;11:e16362. doi: 10.7717/peerj.16362. eCollection 2023. PeerJ. 2023. PMID: 37953785 Free PMC article.
-
Biomarker discovery for non-invasive diagnosis of inflammatory bowel disease using blood transcriptomics.Front Immunol. 2025 Jun 20;16:1570374. doi: 10.3389/fimmu.2025.1570374. eCollection 2025. Front Immunol. 2025. PMID: 40621466 Free PMC article.
-
Exploring the diagnostic markers of essential tremor: A study based on machine learning algorithms.Open Life Sci. 2023 Jun 22;18(1):20220622. doi: 10.1515/biol-2022-0622. eCollection 2023. Open Life Sci. 2023. PMID: 37360784 Free PMC article.
-
Dysregulation of iron transport-related biomarkers in blood leukocytes is associated with poor prognosis of early trauma.Heliyon. 2024 Feb 28;10(5):e27000. doi: 10.1016/j.heliyon.2024.e27000. eCollection 2024 Mar 15. Heliyon. 2024. PMID: 38463887 Free PMC article.
-
Identification of biomarkers associated with inflammatory response in Parkinson's disease by bioinformatics and machine learning.PLoS One. 2025 May 28;20(5):e0320257. doi: 10.1371/journal.pone.0320257. eCollection 2025. PLoS One. 2025. PMID: 40435035 Free PMC article.
References
LinkOut - more resources
Full Text Sources
