. 2023 Jan 30;13(2):230.
doi: 10.3390/brainsci13020230.

Multi-Omics Integration Analysis of TK1 in Glioma: A Potential Biomarker for Predictive, Preventive, and Personalized Medical Approaches

Affiliations

Multi-Omics Integration Analysis of TK1 in Glioma: A Potential Biomarker for Predictive, Preventive, and Personalized Medical Approaches

Chuan Shao et al. Brain Sci. .

Abstract

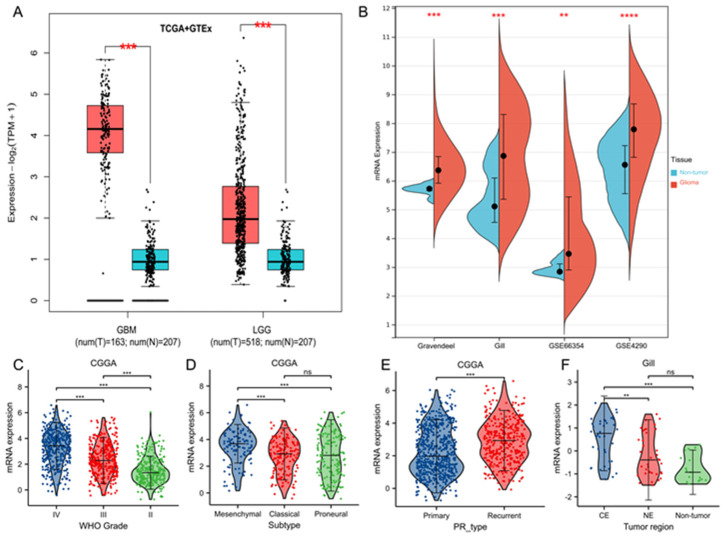
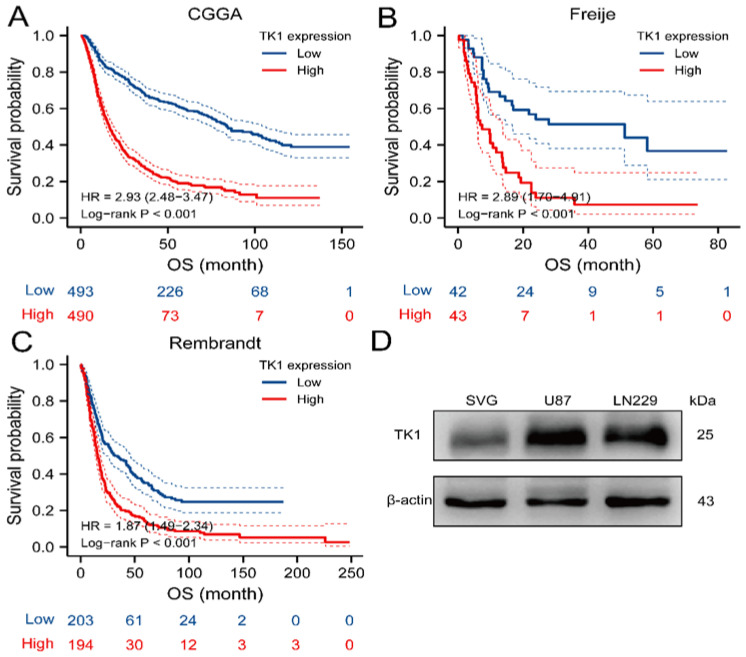
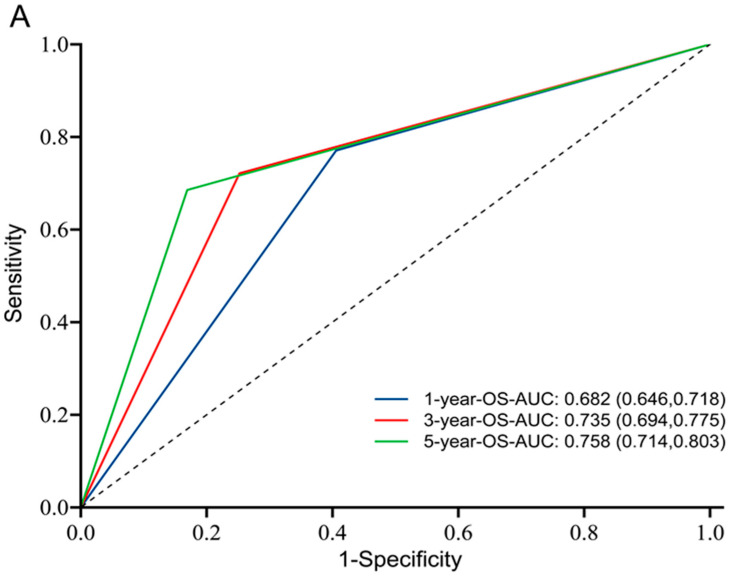
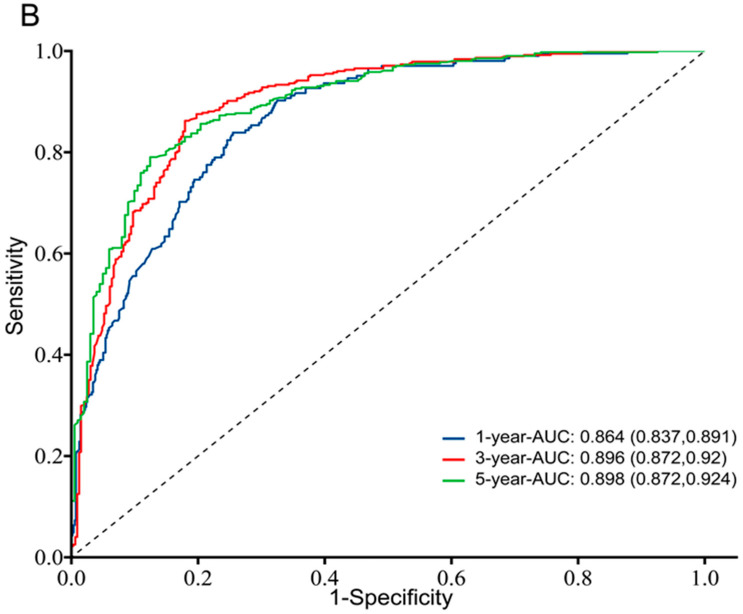
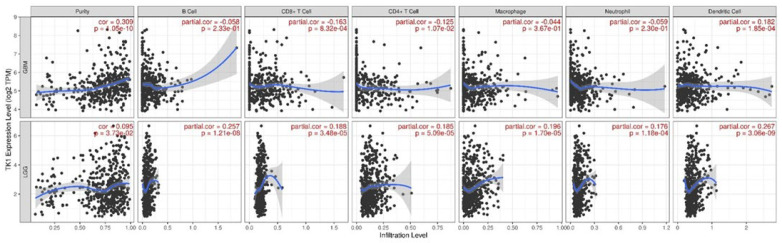
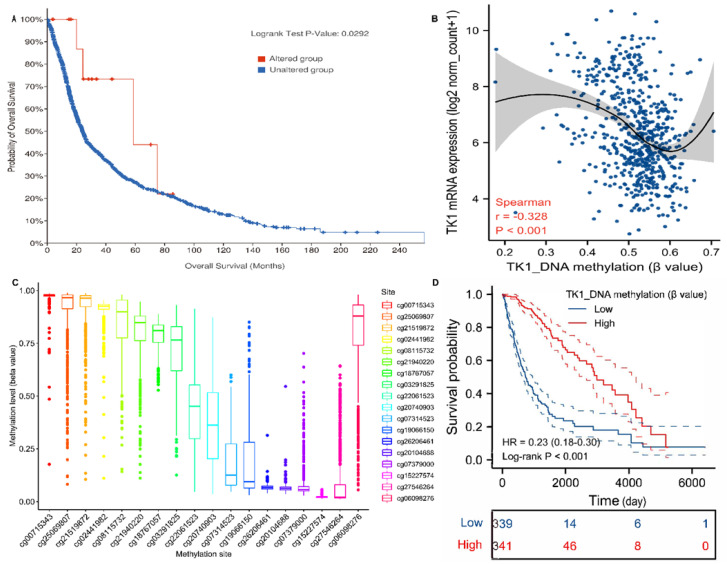
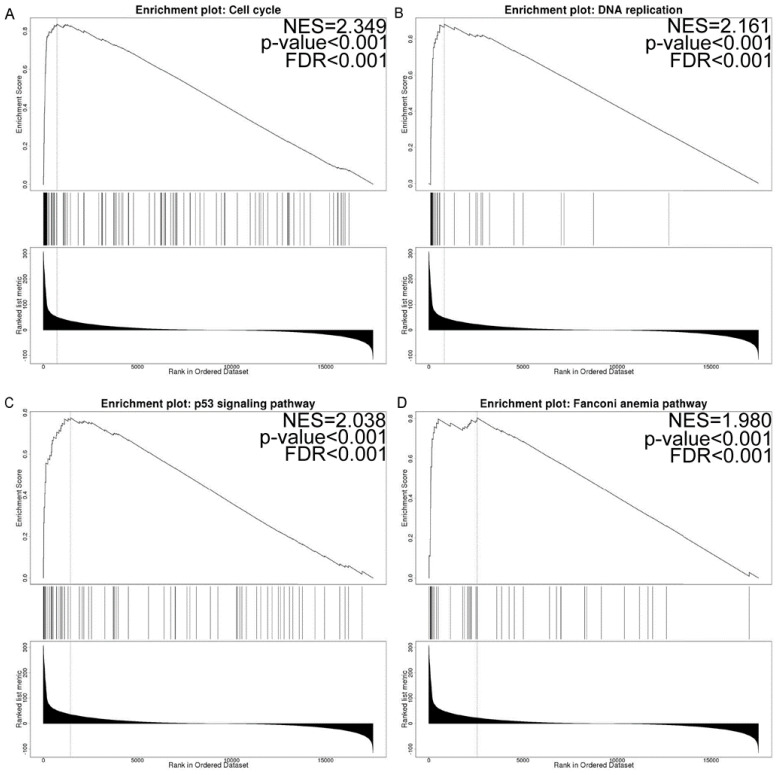
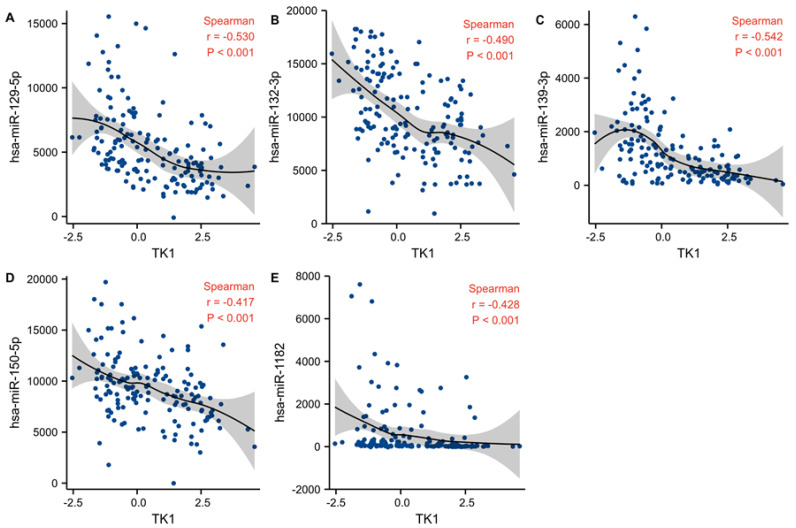
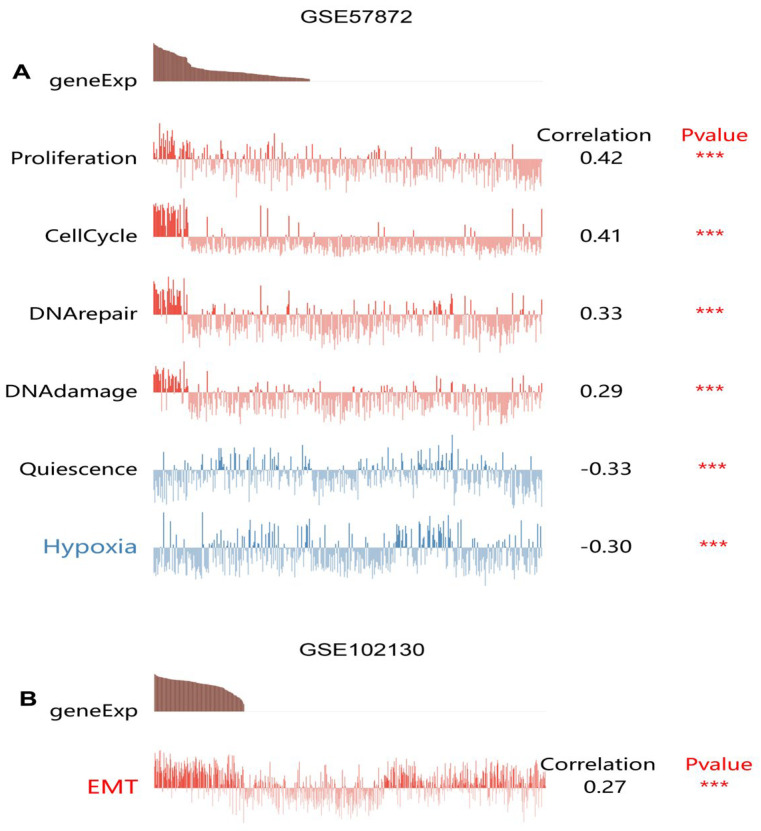
Multi-omics expression datasets obtained from multiple public databases were used to elucidate the biological function of TK1 and its effects on clinical outcomes. The Kaplan-Meier curve, a predictive nomogram mode, and the time-dependent receiver operating characteristic (ROC) curve were established to assess the role of TK1 expression in glioma prognosis. TK1 was overexpressed in glioma compared with normal samples, and patients with elevated expression of TK1 had poor overall survival. The ROC curves indicated a high diagnostic value of TK1 expression in patients of glioma; the areas under the ROC curve (AUC) were 0.682, 0.735, and 0.758 for 1 year, 3 years, and 5 years of glioma survival, respectively. For a model based on TK1 expression and other clinical characteristics, the values of AUC were 0.864, 0.896, and 0.898 for 1 year, 3 years, and 5 years, respectively. Additionally, the calibration curve indicated that the predicted and observed areas at 1 year, 3 years, and 5 years of survival were in excellent agreement. Three types of TK1 alterations-missense mutations, splice mutations, and amplifications-were identified in 25 of 2706 glioma samples. The TK1-altered group had better overall survival than the unaltered group. Single-cell function analysis showed that TK1 was positively associated with proliferation, the cell cycle, DNA repair, DNA damage, and epithelial-mesenchymal transition in glioma. Immunoinfiltration analysis indicated that TK1 expression might play different roles in low-grade glioma and glioblastoma multiforme tumor microenvironments, but TK1 expression was positively associated with activated CD4 and Th2, regardless of tumor grade. In summary, our findings identified TK1 as a novel marker for predicting clinical outcomes and a potential target for glioma.

Keywords: TK1; bioinformatics; glioma; medical informatics; multi-omics integration analysis.


Conflict of interest statement

The authors declare no conflict of interest.

Figures

Figure 1
Figure 1
Upregulated mRNA expression of TK1 in glioma and tumor heterogeneous characteristics of TK1 expression in glioma. (A) TK1 is overexpressed in TCGA glioma tumors compared with the GTEx normal profiles in GEPIA2 database. (B) TK1 is overexpressed in glioma tumors compared with normal profiles in GEO and GlioVis databases. (C) TK1 expression in glioma of WHO grades II, III, and IV. (D) TK1 expression in subtypes of PN, ME, and CL. (E) TK1 expression in recurrent and primary tumors. (F) Different expressions of TK1 in CE and NE regions, which were defined with magnetic resonance imaging. ** p < 0.01, *** p < 0.001 and **** p < 0.0001. Abbreviations: PN, proneural; ME, mesenchymal; CL, classic; CE, contrast-enhanced; NE, non-contrast-enhanced; PR, primary-recurrent; ns, not significant.
Figure 2
Figure 2
Kaplan–Meier analysis of overall survival of TK1 and TK1 protein expression in glioma cell lines and normal brain cell line. (AC) Higher expression of TK1 is associated with poor survival in three datasets, including CGGA (A), Freije (B), and Rembrandt (C). (D) Protein expression of TK1 in glioma cell lines and normal brain cell lines. Abbreviation: OS, overall survival.
Figure 3
Figure 3
A nomogram integrating TK1 expression and clinicopathologic features predicts the clinical outcome of glioma. Abbreviations: OS, overall survival; IDH, isocitrate dehydrogenase.
Figure 4
Figure 4
Time-dependent ROC curves in CGGA dataset. (A) ROC curves to predict 1-year, 3-year, and 5-year OS of glioma patients based on TK1 expression. (B) ROC curves to predict 1-year, 3-year, and 5-year OS of glioma patients based on TK1 expression and seven clinical features, including age, tumor type, WHO tumor grade, IDH mutation status, 1p19q codeletion status, chemotherapy, and radiotherapy. Abbreviations: OS, overall survival; IDH, isocitrate dehydrogenase; ROC, receiver operating characteristic.
Figure 4
Figure 4
Time-dependent ROC curves in CGGA dataset. (A) ROC curves to predict 1-year, 3-year, and 5-year OS of glioma patients based on TK1 expression. (B) ROC curves to predict 1-year, 3-year, and 5-year OS of glioma patients based on TK1 expression and seven clinical features, including age, tumor type, WHO tumor grade, IDH mutation status, 1p19q codeletion status, chemotherapy, and radiotherapy. Abbreviations: OS, overall survival; IDH, isocitrate dehydrogenase; ROC, receiver operating characteristic.
Figure 5
Figure 5
TK1 expression associated with six immune cell infiltration levels in TIMER.
Figure 6
Figure 6
TK1 genetic alternations and DNA methylation. (A) TK1 alternations and the prognoses of TK1 alternations in glioma. (B) An inverse association between TK1 mRNA expression and TK1 DNA methylation in glioma. (C) Kaplan–Meier curves of TK1 DNA methylation. (D) The distribution of 18 TK1 DNA promoter CpG sites in glioma.
Figure 7
Figure 7
GSEA results. (A) Cell cycle. (B) DNA replication. (C) p53 signaling pathway. (D) Fanconi anemia pathway. Abbreviations: GSEA, gene set enrichment analysis; NES, normalized enrichment score; FDR, false discovery rate.
Figure 8
Figure 8
An inverse association between TK1 and hsa-miR-129-5p (A), hsa-miR-132-3p (B), hsa-miR-139-3p (C), hsa-miR-150-5p (D), and hsa-miR-1182 (E).
Figure 9
Figure 9
Kaplan–Meier analysis of overall survival of five TK1-associated miRNAs, including hsa-miR-129-5p (A), hsa-miR-132-3p (B), hsa-miR-139-3p (C), hsa-miR-150-5p (D), and hsa-miR-1182 (E). Abbreviation: OS, overall survival.
Figure 10
Figure 10
Single-cell function analysis of TK1 expression in GSE57872 (A) and GSE 102130 (B) datasets. *** p < 0.001. Abbreviation: EMT, epithelial–mesenchymal transition.

Similar articles

Cited by

References

    1. Ostrom Q.T., Cioffi G., Waite K., Kruchko C., Barnholtz-Sloan J.S. CBTRUS Statistical Report: Primary Brain and Other Central Nervous System Tumors Diagnosed in the United States in 2014–2018. Neuro-Oncol. 2021;23:iii1–iii105. doi: 10.1093/neuonc/noab200. - DOI - PMC - PubMed
    1. Xu S., Tang L., Li X., Fan F., Liu Z. Immunotherapy for glioma: Current management and future application. Cancer Lett. 2020;476:1–12. doi: 10.1016/j.canlet.2020.02.002. - DOI - PubMed
    1. Cabel L., Rosenblum D., Lerebours F., Brain E., Loirat D., Bergqvist M., Cottu P., Donnadieu A., Bethune A., Kiavue N., et al. Plasma thymidine kinase 1 activity and outcome of ER+ HER2- metastatic breast cancer patients treated with palbociclib and endocrine therapy. Breast Cancer Res. 2020;22:98. doi: 10.1186/s13058-020-01334-2. - DOI - PMC - PubMed
    1. Liu C., Wang J., Zhao L., He H., Zhao P., Peng Z., Liu F., Chen J., Wu W., Wang G., et al. Knockdown of Thymidine Kinase 1 Suppresses Cell Proliferation; Invasion; Migration; and Epithelial-Mesenchymal Transition in Thyroid Carcinoma Cells. Front. Oncol. 2020;9:1475. doi: 10.3389/fonc.2019.01475. - DOI - PMC - PubMed
    1. Zuo S., Wang H., Li L., Pan H., Lu L. Thymidine Kinase 1 Drives Skin Cutaneous Melanoma Malignant Progression and Metabolic Reprogramming. Front. Oncol. 2022;12:802807. doi: 10.3389/fonc.2022.802807. - DOI - PMC - PubMed