Review
. 2023 Jan 30;13(2):231.
doi: 10.3390/brainsci13020231.

The Genetics of Intellectual Disability

Affiliations
Review

The Genetics of Intellectual Disability

Sandra Jansen et al. Brain Sci. .

Abstract

Intellectual disability (ID) has a prevalence of ~2-3% in the general population, having a large societal impact. The underlying cause of ID is largely of genetic origin; however, identifying this genetic cause has in the past often led to long diagnostic Odysseys. Over the past decades, improvements in genetic diagnostic technologies and strategies have led to these causes being more and more detectable: from cytogenetic analysis in 1959, we moved in the first decade of the 21st century from genomic microarrays with a diagnostic yield of ~20% to next-generation sequencing platforms with a yield of up to 60%. In this review, we discuss these various developments, as well as their associated challenges and implications for the field of ID, which highlight the revolutionizing shift in clinical practice from a phenotype-first into genotype-first approach.

Keywords: genetics; genotype; intellectual disability; next-generation sequencing; phenotype.


Conflict of interest statement

The authors declare no conflict of interest.

Figures

Figure 1
Figure 1
The IQ distribution of the “normal” population has the shape of a Gaussian curve, with the mean IQ set at 100 IQ points. IQ scores below 70 are observed in ~2.5% of the population. The second curve with the mean around 35 IQ points represents individuals with a pathophysiological cause underlying low IQ measurements (adapted from Zigler et al., 1967 [7]).
Figure 2
Figure 2
Graphical representation of the various concepts in the field of medical genetics. Genetic heterogeneity refers to the concept that pathogenic variants in multiple genes may lead to the same phenotypic presentation, whereas clinical heterogeneity refers to the fact that pathogenic variants in the same gene may lead to different clinical representations. A genotype-first approach starts from the genetic data point of view: after the identification of a pathogenic variant, the phenotype is thoroughly examined. In a phenotype-first approach, the clinical presentation of the patient with ID is obtained first, which is subsequently used as a guide for (targeted) genetic testing.
Figure 3
Figure 3
Schematic overview of the most commonly used cytogenetic and molecular genetic assays employed to elucidate the underlying genetic cause of ID in the pre-NGS era. Of note, genome-wide genetic assays can be used in both a genotype- and phenotype-first approach, whereas the targeted assays are mostly only used in a phenotype-first approach.
Figure 4
Figure 4
Stepwise delineation of the next-generation sequencing approach.
Figure 5
Figure 5
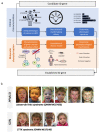
Schematic overview to reclassify a candidate ID gene to an established ID gene, with two successful examples. (a) The use of exome sequencing facilitates the identification of novel disease–gene associations. At first, a single patient is identified to have a (likely) pathogenic variant in a gene not previously associated with the disorder. Two parallel tracks are then started: one focusing on delineating the phenotypic spectrum of patients with (likely) pathogenic variants in the candidate ID gene and one focusing on the delineation of the molecular aspects of gene (dys)function. (b) Facial photos of two NDD syndromes identified through the use of exome sequencing: PPM1D involved in Jansen-de Vries syndrome, and SON in ZTTK syndrome.
Figure 6
Figure 6
Schematic representation of the increase in genes associated with neurodevelopmental disorders and the respective diagnostic yields from assay used to find the underlying genetic cause. (a) The number of genes has significantly increased since the use of NGS-based assays (green line: pre-NGS; orange line: post-NGS, with dashed lines showing the trendline of the increase). (b) Diagnostic yields of the individual techniques when used as singular approach. A targeted strategy provides only a diagnosis in 7% of patients (phenotype-first), whereas the broader genotype-first approaches provide a diagnostic yield of up to ±35%.
Figure 7
Figure 7
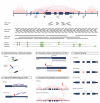
Overview of technological developments and the role of non-coding DNA variants in ID. Top panel shows schematic genomic structure with a gene in a topological-associated domain. Below this structure, different technologies are depicted which are commonly used to identify the genetic cause of NDD, including exome sequencing, short- and long-read genome sequencing and optical genome mapping (in green: labels detected in optical genome mapping technology). In the structure, the letters represent mechanisms, detailed out in the bottom panel, on how variants in non-coding DNA sequence can lead to disease. (A) Rare variants in an enhancer may lead to the distortion of binding of the enhancer to the promoter, effectively resulting in failure of transcription. (B) Rare variants in the 5′UTR may lead to the introduction of a novel translation initiation site, resulting in a shift of reading frame and effectively leading to haploinsufficiency. (C) Rare variants in the intronic sequence may lead—by different mechanisms—lead erroneous splicing, creating an out of frame transcript and resulting in haploinsufficiency. (D) Within the 3′UTR, multiple miRNA binding sites are present to regulate transcription. Rare variants in these sites may prevent miRNA binding and, thus, correct regulation of transcription. (E) Transcriptional regulation by enhancers and silencers is organized within topological-associated domains (TADs). Deletion of such a boundary may place genes under the control of ectopic enhancers and/or silencers of neighboring TADs, leading to dysregulation of gene expression.
Figure 8
Figure 8
Novel strategy for characterizing novel gene mutations by combining the analysis of facial imaging algorithms with genomic data to establish a link between patients’ rare variants and potential facial gestalt.

References

    1. American Psychiatric Association, DSM V. 2013. [(accessed on 1 November 2022)]. Available online: http://www.dsm5.org.
    1. Shevell M., Ashwal S., Donley D., Flint J., Gingold M., Hirtz D., Majnemer A., Noetzel M., Sheth R.D. Practice parameter: Evaluation of the child with global developmental delay: Report of the Quality Standards Subcommittee of the American Academy of Neurology and The Practice Committee of the Child Neurology Society. Neurology. 2003;60:367–380. doi: 10.1212/01.WNL.0000031431.81555.16. - DOI - PubMed
    1. Wieland J., Zitman F.G. It is time to bring borderline intellectual functioning back into the main fold of classification systems. BJPsych Bull. 2016;40:204–206. doi: 10.1192/pb.bp.115.051490. - DOI - PMC - PubMed
    1. Maulik P.K., Mascarenhas M.N., Mathers C.D., Dua T., Saxena S. Prevalence of intellectual disability: A meta-analysis of population-based studies. Res. Dev. Disabil. 2011;32:419–436. doi: 10.1016/j.ridd.2010.12.018. - DOI - PubMed
    1. Spindler U.P., Hotopp L.C., Bach V.A., Hornemann F., Syrbe S., Andreas A., Merkenschlager A., Kiess W., Bernhard M.K., Bertsche T., et al. Seizure disorders and developmental disorders: Impact on life of affected families—A structured interview. Eur. J. Pediatr. 2017;176:1121–1129. doi: 10.1007/s00431-017-2958-0. - DOI - PubMed

LinkOut - more resources