Review
. 2023 Jan 20;13(2):163.
doi: 10.3390/bios13020163.

Microfluidics for COVID-19: From Current Work to Future Perspective

Affiliations
Review

Microfluidics for COVID-19: From Current Work to Future Perspective

Qi Li et al. Biosensors (Basel). .

Abstract

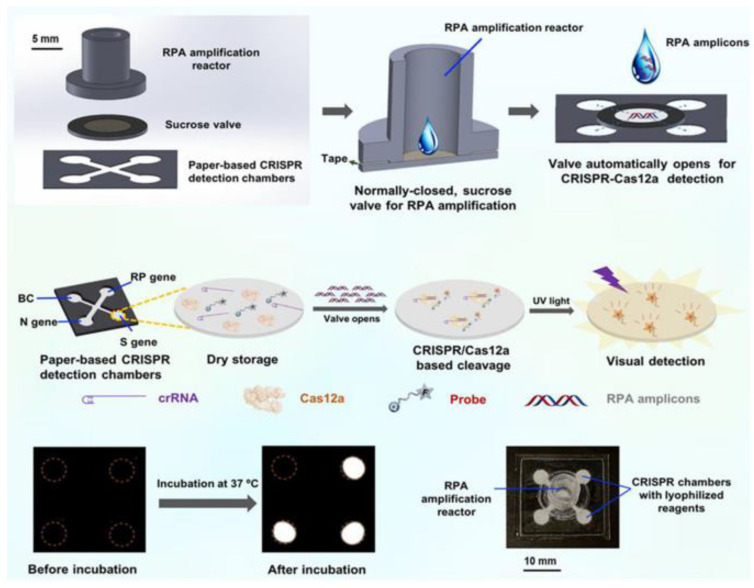
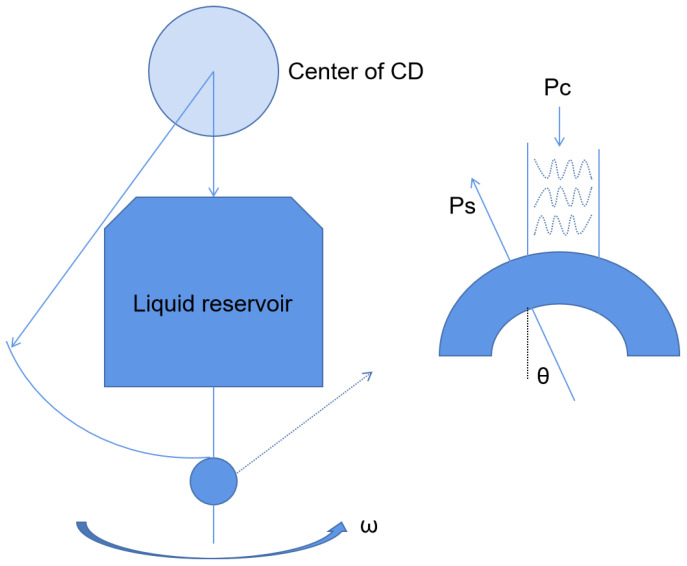
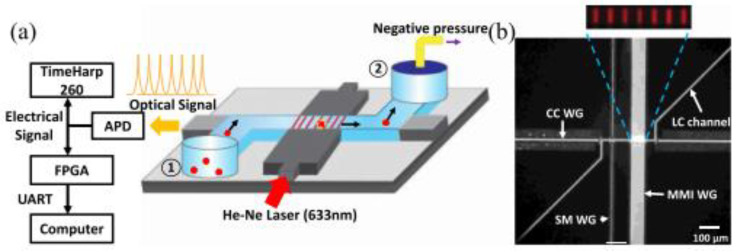
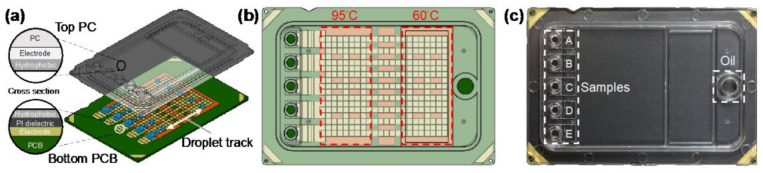
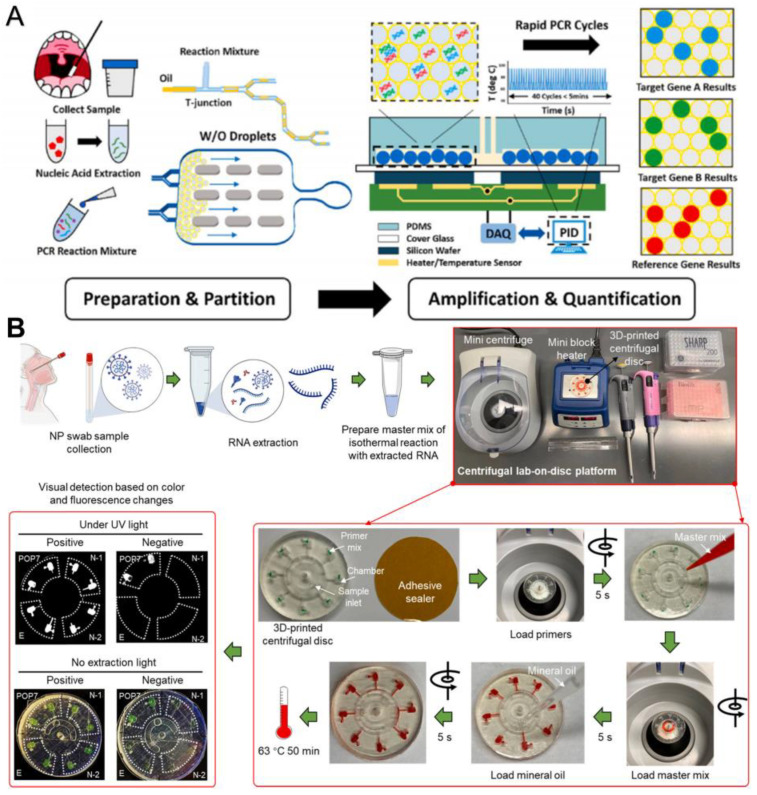
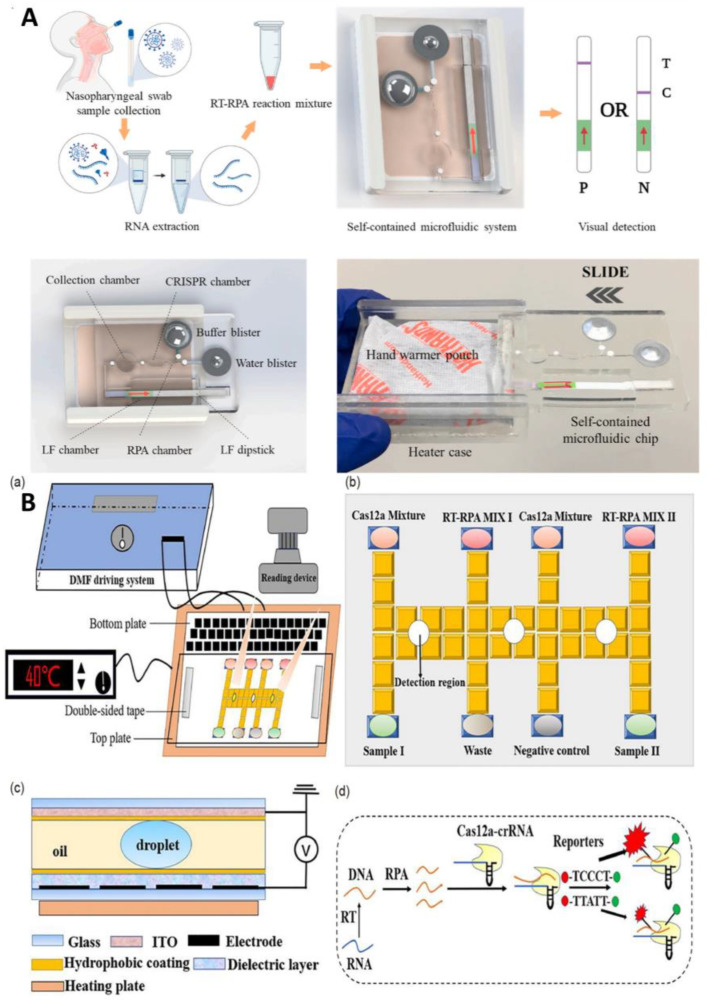
Spread of coronavirus disease 2019 (COVID-19) has significantly impacted the public health and economic sectors. It is urgently necessary to develop rapid, convenient, and cost-effective point-of-care testing (POCT) technologies for the early diagnosis and control of the plague's transmission. Developing POCT methods and related devices is critical for achieving point-of-care diagnosis. With the advantages of miniaturization, high throughput, small sample requirements, and low actual consumption, microfluidics is an essential technology for the development of POCT devices. In this review, according to the different driving forces of the fluid, we introduce the common POCT devices based on microfluidic technology on the market, including paper-based microfluidic, centrifugal microfluidic, optical fluid, and digital microfluidic platforms. Furthermore, various microfluidic-based assays for diagnosing COVID-19 are summarized, including immunoassays, such as ELISA, and molecular assays, such as PCR. Finally, the challenges of and future perspectives on microfluidic device design and development are presented. The ultimate goals of this paper are to provide new insights and directions for the development of microfluidic diagnostics while expecting to contribute to the control of COVID-19.

Keywords: COVID-19; immunoassays; microfluidic; molecular assays.


Conflict of interest statement

The authors declare no conflict of interest.

Figures

Figure 10
Figure 10
Microfluidic laboratory based on labeled immunoassay. (A) The assay progress of SARS-CoV-2 detection from clinical saline gargle samples. Reproduced with permission from Breshears, L. E., PNAS Nexus, published by Oxford Academic, 2022 [72]. (B) Schematic diagram of the microfluidic quantitative detection of SARS-CoV-2. Reproduced with permission from Lee, J. H., Biosens. Bioelectron., published by Elsevier, 2021 [75]. (C) Schematic of automated ELISA on-chip for the detection of anti-SARS-CoV-2 antibodies. Lower right corner: (1) software to control all devices; (2) flow control unit; (3) ELISA reagents; (4) 12/1 bidirectional microfluidic rotary valve; (5) serum samples; (6) microfluidic valve controller; (7) pinch valves; (8) 3/2-way switching valves; (9) microfluidic device; and (10) connections between components and reservoirs (color code: blue is for pneumatic connections, green is for fluid connections, and black is for electrical connections). Reproduced with permission from Gonzalez-Gonzalez, E., Sensors , published by MDPI, 2021 [78].
Figure 1
Figure 1
Different microfluidic platforms classified according to the driving force.
Figure 2
Figure 2
Schematic diagram of paper-based microfluidics for SARS-CoV-2 detection. Reproduced with permission from Li, X., Biosens. Bioelectron., published by Elsevier, 2021 [23].
Figure 3
Figure 3
Schematic diagram of the centrifugal chip principle.
Figure 4
Figure 4
FPGA analysis platform based on ARROW optical flow control device. (a) Schematic diagram of devices used for fluorescence signal acquisition and analysis. (b) Optical microscope image of ARROW optical fluidic device. Reproduced with permission from Mohammad, J, N, S., IEEE Photonics J.; published by IEEE, 2021 [28].
Figure 5
Figure 5
Digital microfluidic cartridge for qPCR of SARS-CoV-2 testing: (a) schematic diagram of the ink cartridge with the droplet trajectory; (b) design of the driving and reservoir electrodes; (c) schematic diagram of the sample inlet position. Reproduced with permission from Kuan, L, H., Micromachines; published by MDPI, 2022 [29].
Figure 6
Figure 6
Microfluidic laboratory based on PCR assay. (A) Workflow of rapid digital PCR. Reproduced with permission from Yin, H., Biosens. Bioelectron., published by Elsevier, 2021 [39]. (B) Procedures of the monolithic, 3D-printed lab-on-disk platform for the rapid, multiplexed detection of SARS-CoV-2. Reproduced with permission from Huang, E., Anal. Bioanal. Chem.; published by Elsevier, 2021 [40].
Figure 7
Figure 7
Schematic of the main components of the microfluidic chip [53].
Figure 8
Figure 8
Microfluidic laboratory based on isothermal amplification technology. (A) Schematic demonstrating the da-Slip Chip for the slip formation of droplets at a high density. Reproduced with permission from Lyu, W., Lab Chip, published by Royal Society of Chemistry, 2021 [57]. (B) Schematics depicting the use of DNA hydrogel formation on microfluidic pores to detect SARS-CoV-2: (a) experimental setup; (b) experimental apparatus; (c) flexible silicon tube bonded to the nylon mesh and glass tube; (d) front view of the silicon tube that prevent leaks; (e) scanning electron image of the nylon mesh; (f) scanning electron image of a single micro-hole of the nylon mesh. Reproduced with permission Kim, H. S., Biosens. Bioelectron., published by Elsevier, 2021 [58].
Figure 9
Figure 9
(A) Schematic diagram of a self-contained microfluidic system for the detection of SARS-CoV-2 in clinical samples. Reproduced with permission from Li, Z., Biosens. Bioelectron., published by Elsevier, 2022 [64]. (B) Schematic drawings of an automated nucleic acid detection platform using digital microfluidics with an optimized Cas12a system. (a) Illustration of the RCD platform. (b) Plan view of. (c) Side view of the chip. (d) Schematic illustration of the RPA-Cas12a-crRNA recognizing target and cleaving the reporter. Reproduced with permission from Sun, Z., Sci. China Chem., published by Springer, 2022 [66].
Figure 11
Figure 11
Microfluidic laboratory based on unlabeled Immunoassay. (A) Disposable photonic assay platform: (a) functionalization schematic, (b) GDS (graphic design system) and laser confocal image, (c) image of antibody/antigen solutions spotted on chips, (d) image of the full microfluidic/photonic chip assembly, and (e) sideview of the custom optical hub. Reproduced with permission from Cognetti, J. S., Sensors, published by MDPI, 2021 [82]. (B) Conceptual illustration of the sensor, measurement system, and N-protein capturing. Reproduced with permission from Qi, H., Anal. Chem., published by American Chemistry Society, 2022 [84].

Similar articles

Cited by

References

    1. Wu Y.C., Chen C.S., Chan Y.J. The outbreak of COVID-19: An overview. J. Chin. Med. Assoc. 2020;83:217–220. doi: 10.1097/JCMA.0000000000000270. - DOI - PMC - PubMed
    1. Remuzzi A., Remuzzi G. COVID-19 and Italy: What next? Lancet. 2020;395:1225–1228. doi: 10.1016/S0140-6736(20)30627-9. - DOI - PMC - PubMed
    1. WHO Coronavirus (COVID-19) Dashboard|WHO Coronavirus (COVID-19) Dashboard with Vaccination Data. [(accessed on 31 October 2022)]. Available online: https://covid19.who.int/
    1. Backer J.A., Klinkenberg D., Wallinga J. Incubation period of 2019 novel coronavirus (2019-nCoV) infections among travellers from Wuhan, China, 20–28 January 2020. Euro Surveill. 2020;25:2000062. doi: 10.2807/1560-7917. - DOI - PMC - PubMed
    1. Wang D., Hu B., Hu C. Transposed Data in a Table. JAMA—J. Am. Med. Assoc. 2021;325:1113. - PMC - PubMed