

Recent Progress in Plasmonic based Electrochemiluminescence Biosensors: A Review
- PMID: 36831966
- PMCID: PMC9953926
- DOI: 10.3390/bios13020200
Recent Progress in Plasmonic based Electrochemiluminescence Biosensors: A Review
Abstract
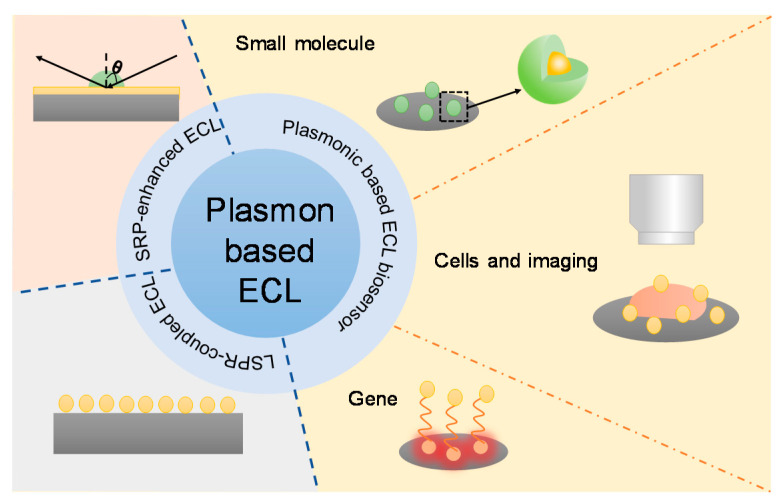
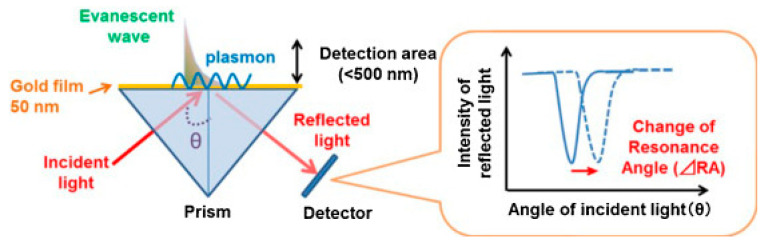
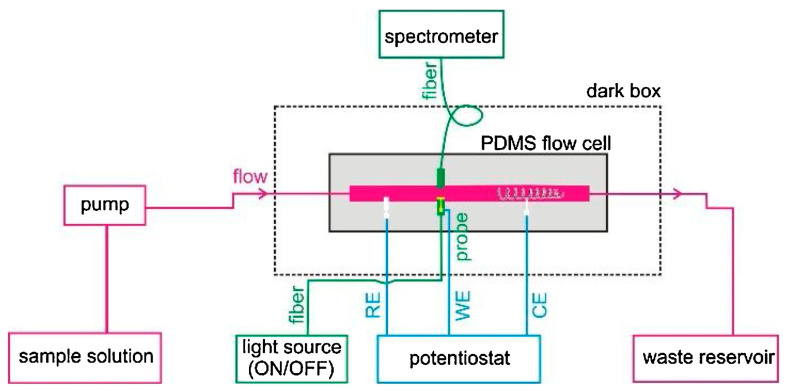
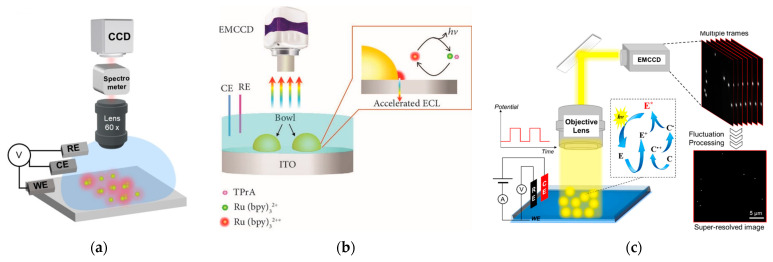
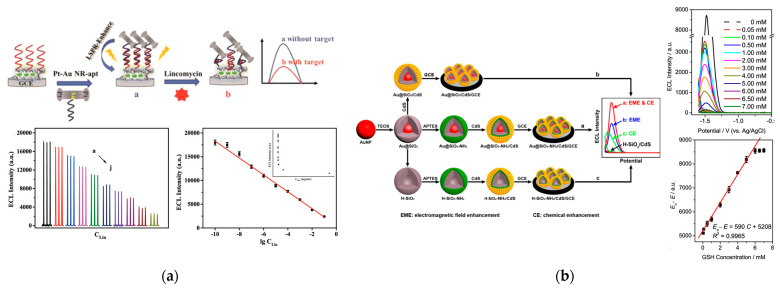
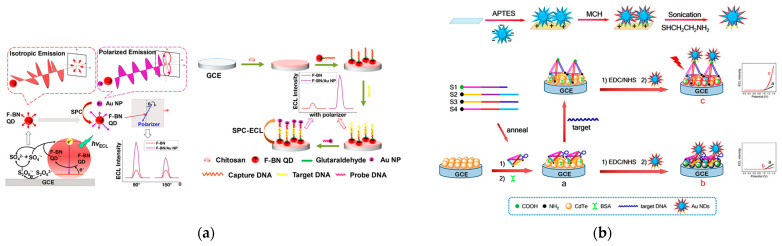
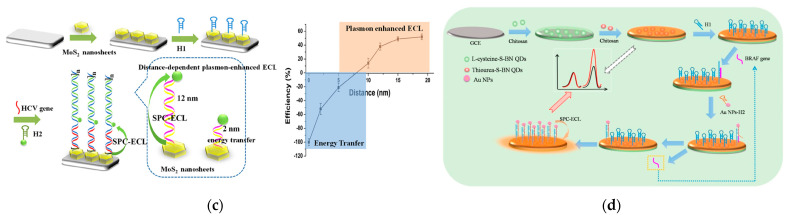
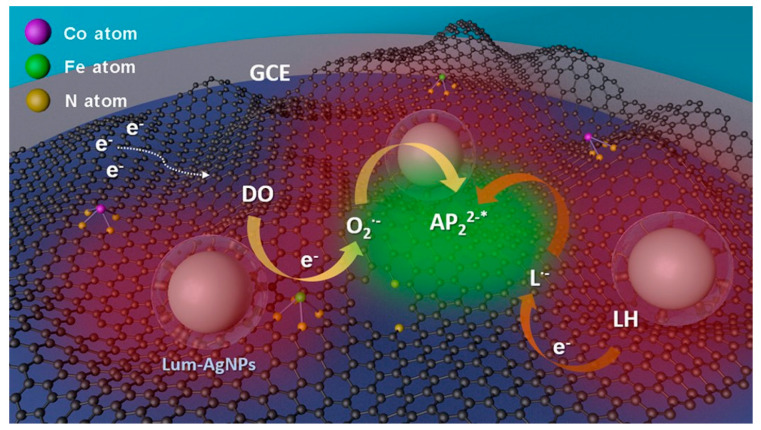
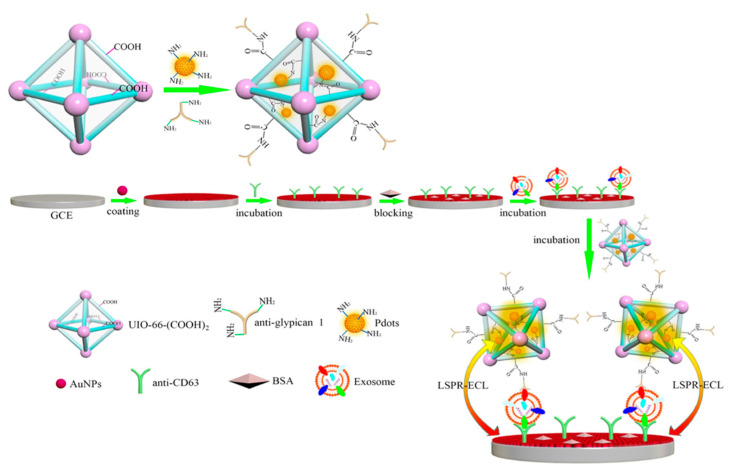
Electrochemiluminescence (ECL) analysis has become a powerful tool in recent biomarker detection and clinic diagnosis due to its high sensitivity and broad linear range. To improve the analytical performance of ECL biosensors, various advanced nanomaterials have been introduced to regulate the ECL signal such as graphene, gold nanomaterials, and quantum dots. Among these nanomaterials, some plasmonic nanostructures play important roles in the fabrication of ECL biosensors. The plasmon effect for the ECL signal includes ECL quenching by resonant energy transfer, ECL enhancement by surface plasmon resonance enhancement, and a change in the polarized angle of ECL emission. The influence can be regulated by the distance between ECL emitters and plasmonic materials, and the characteristics of polarization angle-dependent surface plasmon coupling. This paper outlines the recent advances of plasmonic based ECL biosensors involving various plasmonic materials including noble metals and semiconductor nanomaterials. The detection targets in these biosensors range from small molecules, proteins, nucleic acids, and cells thanks to the plasmonic effect. In addition to ECL biosensors, ECL microscopy analysis with plasmonic materials is also highlighted because of the enhanced ECL image quality by the plasmonic effect. Finally, the future opportunities and challenges are discussed if more plasmonic effects are introduced into the ECL realm.
Keywords: biosensors; electrochemiluminescence; microscopy; nanomaterials; plasmonic.
Conflict of interest statement
The authors declare no conflict of interest.
Figures
Similar articles
-
Synergetic surface enhancement of quantum dots-based electrochemiluminescence with photonic crystal light scattering and metal surface plasmon resonance for sensitive bioanalysis.Talanta. 2024 May 15;272:125773. doi: 10.1016/j.talanta.2024.125773. Epub 2024 Feb 14. Talanta. 2024. PMID: 38359720
-
Electrochemiluminescence of Semiconductor Quantum Dots and Its Biosensing Applications: A Comprehensive Review.Biosensors (Basel). 2023 Jul 5;13(7):708. doi: 10.3390/bios13070708. Biosensors (Basel). 2023. PMID: 37504107 Free PMC article. Review.
-
Nanomaterials-Based Electrochemiluminescence Biosensors for Food Analysis: Recent Developments and Future Directions.Biosensors (Basel). 2022 Nov 18;12(11):1046. doi: 10.3390/bios12111046. Biosensors (Basel). 2022. PMID: 36421164 Free PMC article. Review.
-
Research progress on electrochemiluminescence nanomaterials and their applications in biosensors - A review.Anal Chim Acta. 2025 Aug 1;1361:344148. doi: 10.1016/j.aca.2025.344148. Epub 2025 May 11. Anal Chim Acta. 2025. PMID: 40414672 Review.
-
Gold nanoparticle-based signal amplified electrochemiluminescence for biosensing applications.Talanta. 2022 Oct 1;248:123611. doi: 10.1016/j.talanta.2022.123611. Epub 2022 May 29. Talanta. 2022. PMID: 35660995 Review.
Cited by
-
Molybdenum Disulfide as Tunable Electrochemical and Optical Biosensing Platforms for Cancer Biomarker Detection: A Review.Biosensors (Basel). 2023 Aug 25;13(9):848. doi: 10.3390/bios13090848. Biosensors (Basel). 2023. PMID: 37754082 Free PMC article. Review.
-
Harnessing Nanoplasmonics: Design Optimization for Enhanced Optoelectronic Performance in Nanocrystalline Silicon Devices.Micromachines (Basel). 2025 Apr 30;16(5):540. doi: 10.3390/mi16050540. Micromachines (Basel). 2025. PMID: 40428666 Free PMC article.
-
Plasmonic silver and gold nanoparticles: shape- and structure-modulated plasmonic functionality for point-of-caring sensing, bio-imaging and medical therapy.Chem Soc Rev. 2024 Mar 18;53(6):2932-2971. doi: 10.1039/d3cs00793f. Chem Soc Rev. 2024. PMID: 38380656 Free PMC article. Review.
References
-
- Valenti G., Rampazzo E., Kesarkar S., Genovese D., Fiorani A., Zanut A., Palomba F., Marcaccio M., Paolucci F., Prodi L. Electrogenerated chemiluminescence from metal complexes-based nanoparticles for highly sensitive sensors applications. Coord. Chem. Rev. 2018;367:65–81. doi: 10.1016/j.ccr.2018.04.011. - DOI
Publication types
MeSH terms
Substances
Grants and funding
- 21904063/National Natural Science Foundation of China
- BK20190279/the Natural Science Foundation of Jiangsu Province
- SKLACLS2201/Foundation of State Key Laboratory of Analytical Chemistry for Life Science
- yzuxk202009/Yangzhou University Interdisciplinary Research Foundation for Chemistry Discipline of Targeted Support
LinkOut - more resources
Full Text Sources
