. 2023 Feb 3;13(2):220.
doi: 10.3390/bios13020220.

Pre-Stimulus Power but Not Phase Predicts Prefrontal Cortical Excitability in TMS-EEG

Affiliations

Pre-Stimulus Power but Not Phase Predicts Prefrontal Cortical Excitability in TMS-EEG

Mohsen Poorganji et al. Biosensors (Basel). .

Abstract

The cortical response to transcranial magnetic stimulation (TMS) has notable inter-trial variability. One source of this variability can be the influence of the phase and power of pre-stimulus neuronal oscillations on single-trial TMS responses. Here, we investigate the effect of brain oscillatory activity on TMS response in 49 distinct healthy participants (64 datasets) who had received single-pulse TMS over the left dorsolateral prefrontal cortex. Across all frequency bands of theta (4-7 Hz), alpha (8-13 Hz), and beta (14-30 Hz), there was no significant effect of pre-TMS phase on single-trial cortical evoked activity. After high-powered oscillations, whether followed by a TMS pulse or not, the subsequent activity was larger than after low-powered oscillations. We further defined a measure, corrected_effect, to enable us to investigate brain responses to the TMS pulse disentangled from the power of ongoing (spontaneous) oscillations. The corrected_effect was significantly different from zero (meaningful added effect of TMS) only in theta and beta bands. Our results suggest that brain state prior to stimulation might play some role in shaping the subsequent TMS-EEG response. Specifically, our findings indicate that the power of ongoing oscillatory activity, but not phase, can influence brain responses to TMS. Aligning the TMS pulse with specific power thresholds of an EEG signal might therefore reduce variability in neurophysiological measurements and also has the potential to facilitate more robust therapeutic effects of stimulation.

Keywords: EEG power before TMS; TMS-EEG; brain state; cortical oscillations; phase before TMS.


Conflict of interest statement

Z.J.D. has received research and equipment in-kind support for an investigator-initiated study through Brainsway Inc. and Magventure Inc. He is also on the scientific advisory board for Brainsway Inc. His work has been supported by the National Institutes of Mental Health (NIMH), the Canadian Institutes of Health Research (CIHR), Brain Canada and the Temerty Family, Grant and Kreutzcamp Family Foundations. D.M.B. receives research support from CIHR, NIH, Brain Canada, and the Temerty Family through the CAMH Foundation and the Campbell Research Institute. He received research support and in-kind equipment support for an investigator-initiated study from Brainsway Ltd. and he is the site principal investigator for one sponsor-initiated study for Brainsway Ltd. He also receives in-kind equipment support from Magventure for investigator-initiated studies. He received medication supplies for an investigator-initiated trial from Indivior. He participated in a Scientific Advisory Board for Janssen and Welcony Inc. C.Z. and B.Z. are shareholders of sync2brain GmbH (Tübingen, Germany), a start-up commercializing real-time EEG analysis technology. TKR has received research support from Brain Canada, Brain and Behavior Research Foundation, BrightFocus Foundation, Canada Foundation for Innovation, Canada Research Chair, Canadian Institutes of Health Research, Centre for Aging and Brain Health Innovation, National Institutes of Health, Ontario Ministry of Health and Long-Term Care, Ontario Ministry of Research and Innovation, and the Weston Brain Institute. T.K.R. also received for an investigator-initiated study in-kind equipment support from Newronika, and in-kind research online accounts from Scientific Brain Training Pro, and participated in 2021 in an advisory board for Biogen Canada Inc. DV. holds the Labatt Family Professorship in Depression Biology, a University Named Professorship at the University of Toronto. She receives research support from CIHR, the Centre for Addiction and Mental Health (CAMH) and the Department of Psychiatry at the University of Toronto. D.V. declares no biomedical interests or conflicts. M.P., R.Z., C.H., A.T.H., I.H. and R.C. have nothing to disclose.

Figures

Figure 1
Figure 1
Overall post-processing analysis flow: (a-1) the trials were classified based on the phase of the EEG oscillation before the TMS pulse or control condition using PHASTIMATE toolbox; (a-2) the single-trial TMS-EEG-evoked response, measured by area under the curve of the waveform between 25 and 80 ms (after the TMS pulse or the time of control condition), was compared between different phase categories in each frequency band; (a-3) the mean of power for each subject and every frequency was set as the threshold, and then the AUC of the trials that would pass the threshold were compared between different phase categories in each frequency band; (b-1) the trials were classified based on the power of the EEG oscillation before TMS pulse or control condition into high power (above the median—comprising 50% of the data) and low power (below the median) in each frequency band; (b-2) AUC of high power and low power were compared in each frequency band; (b-3) to isolate the effect of TMS from ongoing brain oscillation, corrected_effect was measured.
Figure 2
Figure 2
Model of the analysis flow to estimate the phase in the alpha band: (a) the data transformed into current source density domain; (b) the data filtered into alpha frequency band; (c) the phase of the filtered data using Hilbert transform was estimated; (d) the data filtered into alpha frequency band to be used in PHASTIMATE toolbox; (e) forward prediction of the signal before TMS pulse after edging it using PHASTIMATE toolbox; (f) forward prediction of the signal 1000 ms before TMS (control condition) after edging it using PHASTIMATE toolbox; (g) the estimated phase of the signal using PHASTIMATE toolbox and Hilbert transform.
Figure 3
Figure 3
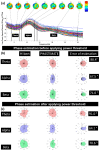
(a) A sample power spectrum for the frequency bands of theta (4–7 Hz), alpha (8–13 Hz), and beta (14–30 Hz); (b) error of phase estimation, using PHASTIMATE toolbox (second column) compared with Hilbert transform (first column) in all the trials, in each frequency band, and without applying the power threshold; (c) error of phase estimation in all the trials which passed the power threshold (mean of power in each frequency band and for every subject). Error of estimation was measured using circular standard deviation [31]. The phase in all the plots is estimated for 1000 ms before TMS pulse.
Figure 4
Figure 4
Corrected_effect. A schematic figure, illustrating the effect of ongoing brain oscillation on the post stimuli area under the curve and the added evoked response of TMS to the amplitude of ongoing low- and high-power oscillations. The corrected_effect, calculated based on Equation (3), illustrates the isolated effect of TMS pulse when the effect of ongoing brain oscillation is removed. The corrected_effect was significantly larger than zero only in the theta and beta bands (p < 0.01).
Figure 5
Figure 5
Effect of phase of ongoing EEG oscillation on single-trial TMS-EEG response. (a) Mean rectified TMS-evoked EEG activity, measured by normalized AUC(TMS), for different phases of positive peak, 90°, negative peak, and 270° over the three frequency bands of theta, alpha, and beta before and after the power threshold (mean power) is applied. (b) Comparison of the normalized area under the curve for the control condition (AUC(Control)) for different phases of positive peak, 90°, negative peak, and 270° over the three frequency bands of theta, alpha, and beta before and after the power threshold (mean power) is applied. None of the comparisons reached the significance level.
Figure 6
Figure 6
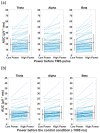
Effect of power of ongoing EEG oscillation on single-trial TMS-EEG response measured by area under the curve (AUC) after TMS pulse and in the Control condition with mean and standard deviation also shown (black). (a) Mean rectified TMS-evoked EEG activity, measured by area under the curve (AUC(TMS)) for low power and high power over the three frequency bands of theta, alpha, and beta in healthy group. (b) Comparison of the area under the curve for the control condition (AUC(Control)) for low power and high power over the three frequency bands of theta, alpha, and beta. High power resulted in significantly larger AUC (p < 0.001) compared with low power, both in TMS and control conditions in theta, alpha, and beta frequency bands.

References

    1. Barker A.T., Jalinous R., Freeston I.L. Non-invasive magnetic stimulation of human motor cortex. Lancet. 1985;325:1106–1107. doi: 10.1016/S0140-6736(85)92413-4. - DOI - PubMed
    1. Rossini P.M., Burke D., Chen R., Cohen L.G., Daskalakis Z., Di Iorio R., Di Lazzaro V., Ferreri F., Fitzgerald P.B., George M.S., et al. Non-Invasive Electrical and Magnetic Stimulation of the Brain, Spinal Cord, Roots and Peripheral Nerves: Basic Principles and Procedures for Routine Clinical and Research Application. An Updated Report from an I.F.C.N. Committee. Clin. Neurophysiol. 2015;126:1071–1107. doi: 10.1016/j.clinph.2015.02.001. - DOI - PMC - PubMed
    1. Farzan F., Vernet M., Shafi M.M.D., Rotenberg A., Daskalakis Z.J., Pascual-Leone A. Characterizing and Modulating Brain Circuitry through Transcranial Magnetic Stimulation Combined with Electroencephalography. Front. Neural Circuits. 2016;10 doi: 10.3389/fncir.2016.00073. - DOI - PMC - PubMed
    1. Hui J., Tremblay S., Daskalakis Z.J. The Current and Future Potential of Transcranial Magnetic Stimulation With Electroencephalography in Psychiatry. Clin. Pharmacol. Ther. 2019;106:734–746. doi: 10.1002/cpt.1541. - DOI - PubMed
    1. Tremblay S., Rogasch N.C., Premoli I., Blumberger D.M., Casarotto S., Chen R., Di Lazzaro V., Farzan F., Ferrarelli F., Fitzgerald P.B., et al. Clinical Utility and Prospective of TMS–EEG. Clin. Neurophysiol. 2019;130:802–844. doi: 10.1016/j.clinph.2019.01.001. - DOI - PubMed

Publication types