. 2023 Feb 17;13(2):290.
doi: 10.3390/bios13020290.

Microfluidic Wound-Healing Assay for ECM and Microenvironment Properties on Microglia BV2 Cells Migration

Affiliations

Microfluidic Wound-Healing Assay for ECM and Microenvironment Properties on Microglia BV2 Cells Migration

Ehsan Yazdanpanah Moghadam et al. Biosensors (Basel). .

Abstract

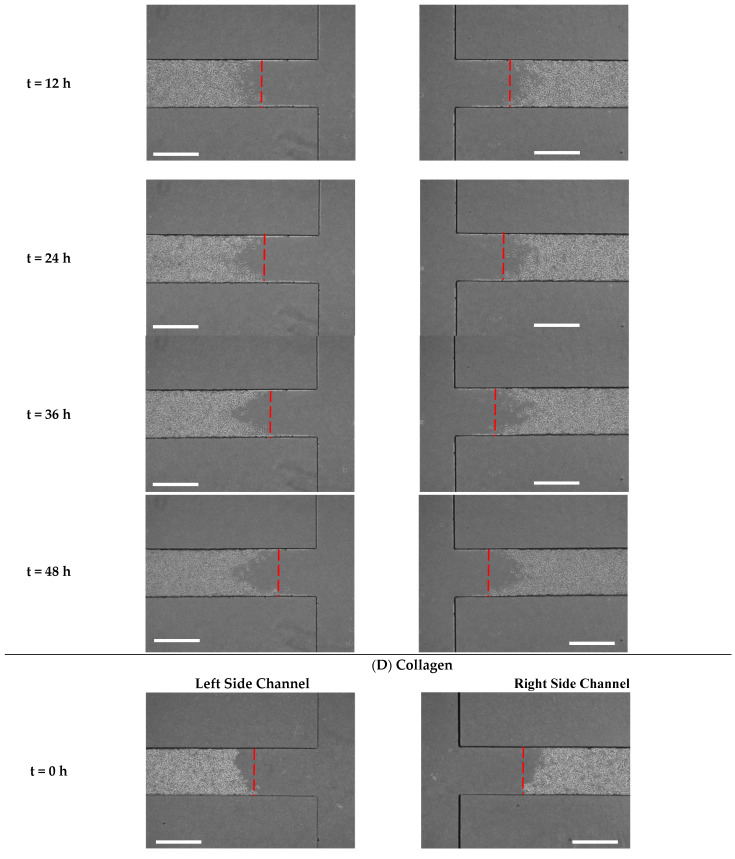
Microglia cells, as the resident immune cells of the central nervous system (CNS), are highly motile and migratory in development and pathophysiological conditions. During their migration, microglia cells interact with their surroundings based on the various physical and chemical properties in the brain. Herein, a microfluidic wound-healing chip is developed to investigate microglial BV2 cell migration on the substrates coated with extracellular matrixes (ECMs) and substrates usually used for bio-applications on cell migration. In order to generate the cell-free space (wound), gravity was utilized as a driving force to flow the trypsin with the device. It was shown that, despite the scratch assay, the cell-free area was created without removing the extracellular matrix coating (fibronectin) using the microfluidic assay. It was found that the substrates coated with Poly-L-Lysine (PLL) and gelatin stimulated microglial BV2 migration, while collagen and fibronectin coatings had an inhibitory effect compared to the control conditions (uncoated glass substrate). In addition, the results showed that the polystyrene substrate induced higher cell migration than the PDMS and glass substrates. The microfluidic migration assay provides an in vitro microenvironment closer to in vivo conditions for further understanding the microglia migration mechanism in the brain, where the environment properties change under homeostatic and pathological conditions.

Keywords: cell migration; extracellular matrix coating; microfluidic wound-healing migration assay; microglia cells; substrate rigidity.


Conflict of interest statement

The authors declare no conflict of interest.

Figures

Figure 1
Figure 1
Schematic of the microfluidic device. (A) exploded view of the two PDMS layers that bonded on the substrate. (B) Actual photography of the microfluidic device with the microchannels filled with red dye, 3D view, scale bar = 15 mm. (C) Geometrical configuration, top view.
Figure 2
Figure 2
Cell seeding to cell confluence in the microfluidic wound-healing assay. (A) cell loading, (B) cells attached to the substrate after 40 min, (C) confluency of the cells after 12 h, scale bar = 600 µm.
Figure 2
Figure 2
Cell seeding to cell confluence in the microfluidic wound-healing assay. (A) cell loading, (B) cells attached to the substrate after 40 min, (C) confluency of the cells after 12 h, scale bar = 600 µm.
Figure 3
Figure 3
Process of cell-free generation. (A) Experiment setup. While the terminals of the side channels were blocked, trypsin was added to the inlet. (B) Side view and (C) top view, gravity as a driving force was used to flow the trypsin from the inlet to the outlet to generate the cell-free area in the main channel.
Figure 4
Figure 4
Fluorescence images from the device (A) glass substrate without coating (the control condition), (B) glass substrate coated with fibronectin before performing the process of the cell-free area creation (no flowing within the device), and (C) glass substrate coated with fibronectin after generating the cell-free area. (D) Quantification of the fluorescence intensity in the side channels in cases A, B and C, scale bar = 600 µm.
Figure 5
Figure 5
Time-lapse images from cell migration on the substrates of (A) glass, (B) polystyrene (C) PDMS after 0, 12, 24, 36 and 48 h, scale bar = 600 µm.
Figure 5
Figure 5
Time-lapse images from cell migration on the substrates of (A) glass, (B) polystyrene (C) PDMS after 0, 12, 24, 36 and 48 h, scale bar = 600 µm.
Figure 5
Figure 5
Time-lapse images from cell migration on the substrates of (A) glass, (B) polystyrene (C) PDMS after 0, 12, 24, 36 and 48 h, scale bar = 600 µm.
Figure 5
Figure 5
Time-lapse images from cell migration on the substrates of (A) glass, (B) polystyrene (C) PDMS after 0, 12, 24, 36 and 48 h, scale bar = 600 µm.
Figure 6
Figure 6
Quantification of cell migration on glass, polystyrene and PDMS substrates. (A) cell migration area and (B) distance substrates at 0 h, 12 h, 24 h, 36 h and 48 h after creating the cell-free area and (C) migration rate of the cells after 48 h. Quantification of cell migration on glass (control), PLL, fibronectin, collagen and gelatin-coated substrates. (D) cell migration area and (E) distance at 0 h, 12 h, 24 h, 36 h and 48 h after generating the cell-free area, and (F) migration rate of the cells after 48 h. Value was shown as mean ± SD. For each condition, five independent experiments were performed (n = 5). *: p < 0.5, **: p < 0.01, ***: p < 0.0001 and ****: p < 0.0001.
Figure 7
Figure 7
Time-lapse images from cell migration on the substrates of (A) PLL, (B) gelatin, (C) fibronectin, (D) collagen after 0, 12, 24, 36 and 48 h, scale bar = 600 µm.
Figure 7
Figure 7
Time-lapse images from cell migration on the substrates of (A) PLL, (B) gelatin, (C) fibronectin, (D) collagen after 0, 12, 24, 36 and 48 h, scale bar = 600 µm.
Figure 7
Figure 7
Time-lapse images from cell migration on the substrates of (A) PLL, (B) gelatin, (C) fibronectin, (D) collagen after 0, 12, 24, 36 and 48 h, scale bar = 600 µm.
Figure 7
Figure 7
Time-lapse images from cell migration on the substrates of (A) PLL, (B) gelatin, (C) fibronectin, (D) collagen after 0, 12, 24, 36 and 48 h, scale bar = 600 µm.
Figure 7
Figure 7
Time-lapse images from cell migration on the substrates of (A) PLL, (B) gelatin, (C) fibronectin, (D) collagen after 0, 12, 24, 36 and 48 h, scale bar = 600 µm.

References

    1. Ortega-Carrion A., Feo-Lucas L., Vicente-Manzanares M. Cell Migration. Encycl. Cell Biol. 2016;2:720–730. doi: 10.1016/b978-0-12-394447-4.20070-9. - DOI
    1. Qu F., Guilak F., Mauck R.L. Cell migration: Implications for repair and regeneration in joint disease. Nat. Rev. Rheumatol. 2019;15:167–179. doi: 10.1038/s41584-018-0151-0. - DOI - PMC - PubMed
    1. Painter K.J. Modelling cell migration strategies in the extracellular matrix. J. Math. Biol. 2009;58:511–543. doi: 10.1007/s00285-008-0217-8. - DOI - PubMed
    1. Chaudhuri O., Cooper-White J., Janmey P.A., Mooney D.J., Shenoy V.B. Effects of extracellular matrix viscoelasticity on cellular behaviour. Nature. 2020;584:535–546. doi: 10.1038/s41586-020-2612-2. - DOI - PMC - PubMed
    1. Chang S.S., Guo W.-H., Kim Y., Wang Y.-L. Guidance of Cell Migration by Substrate Dimension. Biophys. J. 2013;104:313–321. doi: 10.1016/j.bpj.2012.12.001. - DOI - PMC - PubMed

LinkOut - more resources