. 2023 Feb 16;13(4):758.
doi: 10.3390/diagnostics13040758.

Performance of T-Track® TB, a Novel Dual Marker RT-qPCR-Based Whole-Blood Test for Improved Detection of Active Tuberculosis

Affiliations

Performance of T-Track® TB, a Novel Dual Marker RT-qPCR-Based Whole-Blood Test for Improved Detection of Active Tuberculosis

Johannes P Meier et al. Diagnostics (Basel). .

Abstract

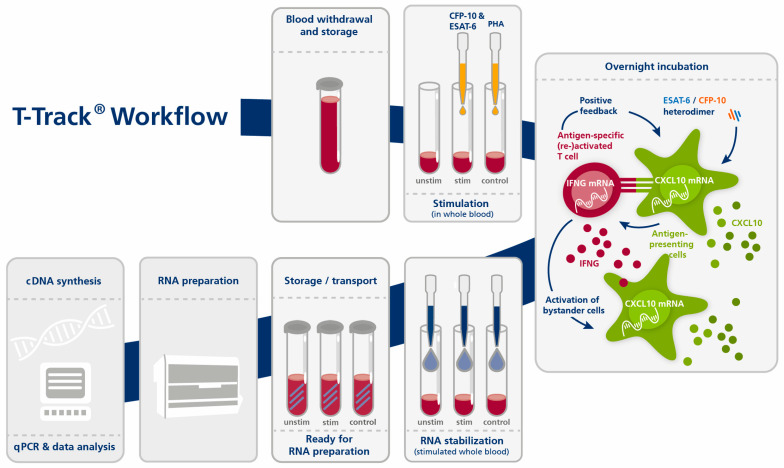
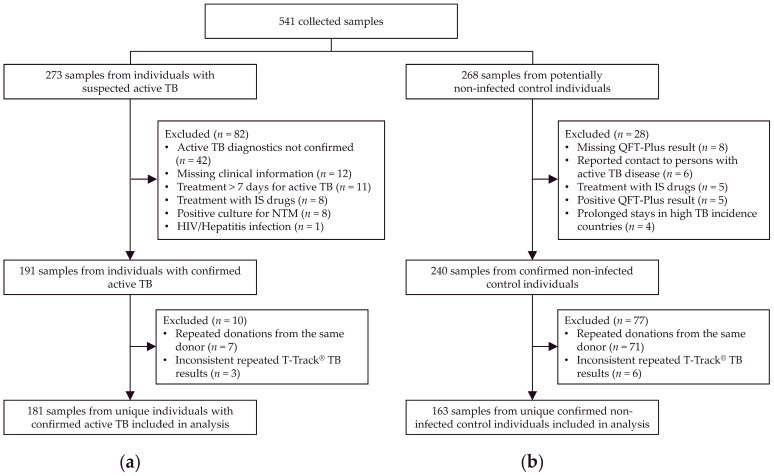
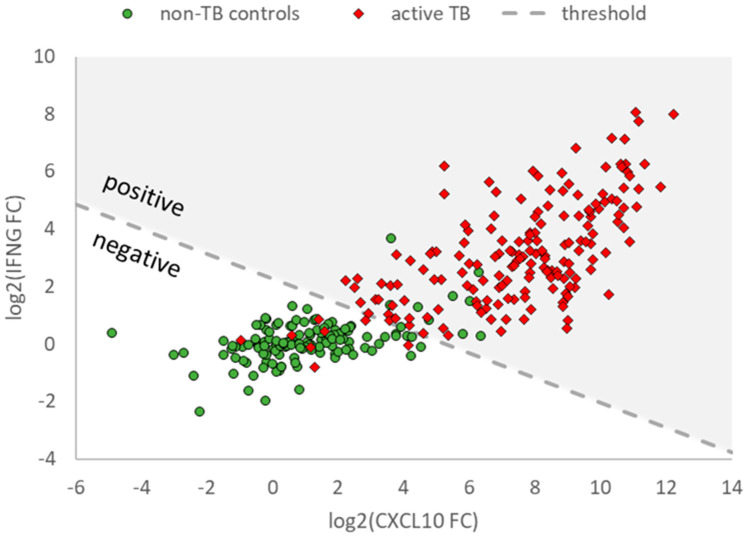
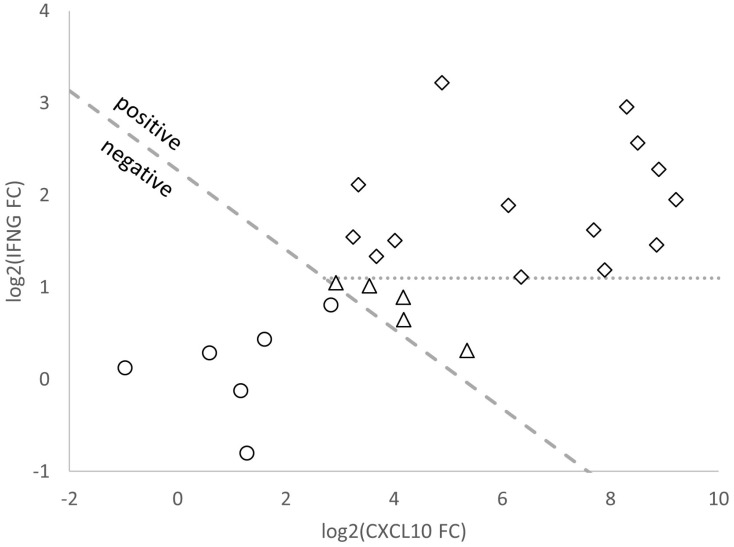
Tuberculosis (TB) is one of the leading causes of death by an infectious disease. It remains a major health burden worldwide, in part due to misdiagnosis. Therefore, improved diagnostic tests allowing the faster and more reliable diagnosis of patients with active TB are urgently needed. This prospective study examined the performance of the new molecular whole-blood test T-Track® TB, which relies on the combined evaluation of IFNG and CXCL10 mRNA levels, and compared it to that of the QuantiFERON®-TB Gold Plus (QFT-Plus) enzyme-linked immunosorbent assay (ELISA). Diagnostic accuracy and agreement analyses were conducted on the whole blood of 181 active TB patients and 163 non-TB controls. T-Track® TB presented sensitivity of 94.9% and specificity of 93.8% for the detection of active TB vs. non-TB controls. In comparison, the QFT-Plus ELISA showed sensitivity of 84.3%. The sensitivity of T-Track® TB was significantly higher (p < 0.001) than that of QFT-Plus. The overall agreement of T-Track® TB with QFT-Plus to diagnose active TB was 87.9%. Out of 21 samples with discordant results, 19 were correctly classified by T-Track® TB while misclassified by QFT-Plus (T-Track® TB-positive/QFT-Plus-negative), and two samples were misclassified by T-Track® TB while correctly classified by QFT-Plus (T-Track® TB-negative/QFT-Plus-positive). Our results demonstrate the excellent performance of the T-Track® TB molecular assay and its suitability to accurately detect TB infection and discriminate active TB patients from non-infected controls.

Keywords: CXCL10; IFNG; QuantiFERON®-TB Gold Plus; RT-qPCR; T-Track® TB; TB; active TB; infection detection; mRNA; tuberculosis.


Conflict of interest statement

J.P.M., S.M., F.H., L.D. and S.B. are employees of Mikrogen. J.P.M., S.M., F.H., A.A.-N., L.D. and S.B. were employees of Lophius Biosciences (meanwhile acquired by Mikrogen). L.D. is the co-founder and Chief Scientific Officer of Lophius Biosciences. R.W. is Chairman of the Board of Lophius Biosciences. R.W., L.D. and S.B. are shareholders of Lophius Biosciences. The participating clinical and measurement centers received research funding from Lophius Biosciences for this study. Lophius Biosciences and then Mikrogen played a role in the design of the study, in the collection, analysis and interpretation of data, in the decision to publish the results, and in the writing of the manuscript.

Figures

Figure 1
Figure 1
Principle and workflow of the T-Track® TB assay. Abbreviations: cDNA, complementary DNA; control, stimulation control (PHA-stimulated); ESAT-6, Early Secreted Antigenic Target 6 kDa (TB antigen); CFP-10, Culture Filtrate Protein 10 (TB antigen); CXCL10, C-X-C motif chemokine ligand 10 (biomarker); IFNG, interferon gamma (biomarker); PHA, phytohemagglutinin; qPCR, quantitative PCR; stim, stimulated (with TB antigens); unstim, unstimulated negative control.
Figure 2
Figure 2
Study flow diagram. Out of 541 collected samples, 273 were from patients with suspected active TB (a) and 268 from presumed non-infected individuals (b). After exclusion of samples not meeting inclusion/exclusion criteria, and exclusion of samples from multiple collections from the same donor and with inconsistent T-Track® TB results upon repeated testing, a total of 344 samples were analyzed, including 181 from patients with confirmed active TB (a) and 163 from confirmed non-infected controls (b). Abbreviations: HIV, human immunodeficiency virus; IGRA, interferon-gamma release assay; IS, immunosuppressive; MTC Mycobacterium tuberculosis complex; NTM, nontuberculous mycobacteria; QFT-Plus, QuantiFERON®-TB Gold Plus; TB, tuberculosis.
Figure 3
Figure 3
IFNG and CXCL10 mRNA expression levels in samples from patients with active TB and uninfected study participants obtained with T-Track® TB. Scatter plot showing valid log2-transformed fold change (FC) values of IFNG and CXCL10 mRNA levels in samples from patients with active TB (red diamonds) and uninfected study participants (green circles). Only samples with valid results for both markers are shown (n = 176 active TB, n = 135 non-TB controls). The dashed line (classification threshold) classifies the samples into “positive” (upper right) and “negative” (lower left).
Figure 4
Figure 4
Scatter plot of log2 fold change (FC) values of CXCL10 and IFNG mRNA expression generated by T-Track® TB from samples of 25 TB patients classified as false negative by QFT-Plus. Samples shown with white circles were also misclassified by T-Track® TB (rated as negative by both assays). Samples shown with diamonds and triangles were correctly classified based on log2-transformed FC values of IFNG and CXCL10 mRNA markers by T-Track® TB. Samples shown with diamonds above the dashed line were also classified as positive by the determination of the IFNG mRNA marker alone, as opposed to the samples shown as triangles below the dashed line. This indicates the benefit of combining IFNG and CXCL10 mRNA FC results in T-Track® TB to improve assay sensitivity.
Figure 5
Figure 5
Correlation analysis between QFT-Plus results for (a) TB1-Nil or (b) TB2-Nil (IU/mL) and T-Track® TB distance values for 164 donors with active TB. The 19 TB patients misclassified by QFT-Plus are shown as black circles, the 2 patients misclassified by T-Track® TB are depicted as white circles and the 6 patients falsely classified by both tests in black–white circles. TB patients correctly classified with both tests are depicted in grey. The vertical dashed line depicts the T-Track® TB classification threshold defining the T-Track® TB assay result (“positive” vs. “negative”), and the horizontal dashed line represents the QFT-Plus threshold. Regression analysis was performed by linear correlation. QFT-Plus+/−, positive/negative QuantiFERON®-TB Gold Plus test result; T-Track TB+/−, positive/negative T-Track® TB test result.

Similar articles

Cited by

References

    1. World Health Organization (WHO) Tuberculosis (TB) [(accessed on 3 November 2022)]. Available online: https://www.who.int/news-room/fact-sheets/detail/tuberculosis.
    1. TB Alliance Global Pandemic. [(accessed on 3 November 2022)]. Available online: https://www.tballiance.org/why-new-tb-drugs/global-pandemic.
    1. Thillai M., Pollock K., Pareek M., Lalvani A. Interferon-gamma release assays for tuberculosis: Current and future applications. Expert Rev. Respir. Med. 2014;8:67–78. doi: 10.1586/17476348.2014.852471. - DOI - PubMed
    1. Grinsdale J.A., Ho C.S., Banouvong H., Kawamura L.M. Programmatic impact of using QuantiFERON®-TB gold in routine contact investigation activities. Int. J. Tuberc. Lung Dis. 2011;15:1614–1620. doi: 10.5588/ijtld.11.0102. - DOI - PubMed
    1. Piccini P., Chiappini E., Tortoli E., de Martino M., Galli L. Clinical peculiarities of Tuberculosis. BMC Infect. Dis. 2014;14((Suppl. 1)):S4. doi: 10.1186/1471-2334-14-S1-S4. - DOI - PMC - PubMed

LinkOut - more resources