

Digital Patient-Reported Outcome Measures Assessing Health-Related Quality of Life in Skull Base Diseases-Analysis of Feasibility and Pitfalls Two Years after Implementation
- PMID: 36833006
- PMCID: PMC9956346
- DOI: 10.3390/healthcare11040472
Digital Patient-Reported Outcome Measures Assessing Health-Related Quality of Life in Skull Base Diseases-Analysis of Feasibility and Pitfalls Two Years after Implementation
Abstract
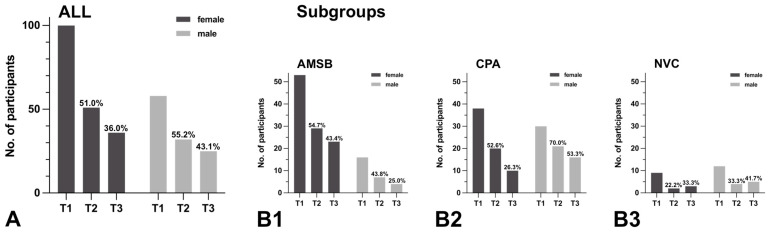
Health-related quality of life (HRQoL) assessment is becoming increasingly important in neurosurgery following the trend toward patient-centered care, especially in the context of skull base diseases. The current study evaluates the systematic assessment of HRQoL using digital patient-reported outcome measures (PROMs) in a tertiary care center specialized in skull base diseases. The methodology and feasibility to conduct digital PROMs using both generic and disease-specific questionnaires were investigated. Infrastructural and patient-specific factors affecting participation and response rates were analyzed. Since August 2020, 158 digital PROMs were implemented in skull base patients presenting for specialized outpatient consultations. Reduced personnel capacity led to significantly fewer PROMs being conducted during the second versus (vs.) the first year after introduction (mean: 0.77 vs. 2.47 per consultation day, p = 0.0002). The mean age of patients not completing vs. those completing long-term assessments was significantly higher (59.90 vs. 54.11 years, p = 0.0136). Follow-up response rates tended to be increased with recent surgery rather than with the wait-and-scan strategy. Our strategy of conducting digital PROMs appears suitable for assessing HRQoL in skull base diseases. The availability of medical personnel for implementation and supervision was essential. Response rates during follow-up tended to be higher both with younger age and after recent surgery.
Keywords: HRQoL; PROM; digital outcome measures; neurosurgery; patient-centered care; quality of life; skull base.
Conflict of interest statement
The authors declare no conflict of interest.
Figures
Similar articles
-
Investigating Digital Patient-Reported Outcome Measures in Patient-Centered Diabetes Specialist Outpatient Care (DigiDiaS): Protocol for a Multimethod Prospective Observational Study.JMIR Res Protoc. 2024 Mar 5;13:e52766. doi: 10.2196/52766. JMIR Res Protoc. 2024. PMID: 38441955 Free PMC article.
-
Routinely measuring symptom burden and health-related quality of life in dialysis patients: first results from the Dutch registry of patient-reported outcome measures.Clin Kidney J. 2020 Feb 3;14(6):1535-1544. doi: 10.1093/ckj/sfz192. eCollection 2021 Jun. Clin Kidney J. 2020. PMID: 34285801 Free PMC article.
-
Patient-Reported Outcome Measures in Sports Medicine: A Concise Resource for Clinicians and Researchers.J Athl Train. 2020 Apr;55(4):390-408. doi: 10.4085/1062-6050-171-19. Epub 2020 Feb 7. J Athl Train. 2020. PMID: 32031883 Free PMC article.
-
A review of health-related quality of life patient-reported outcome measures in cardiovascular nursing.Eur J Cardiovasc Nurs. 2016 Apr;15(2):114-25. doi: 10.1177/1474515116637980. Eur J Cardiovasc Nurs. 2016. PMID: 27006403 Review.
-
Optimal assessment tools in assessing breast surgery: patient reported outcome measures (PROMs) vs. objective measures.Gland Surg. 2019 Aug;8(4):416-424. doi: 10.21037/gs.2019.02.04. Gland Surg. 2019. PMID: 31538067 Free PMC article. Review.
Cited by
-
The impact of electronic versus paper-based data capture on data collection logistics and on missing scores in thyroid cancer patients.Endocrine. 2024 May;84(2):635-645. doi: 10.1007/s12020-023-03628-9. Epub 2023 Dec 16. Endocrine. 2024. PMID: 38103143 Free PMC article.
-
Digital Health Innovations to Catalyze the Transition to Value-Based Health Care.JMIR Med Inform. 2025 Jan 20;13:e57385. doi: 10.2196/57385. JMIR Med Inform. 2025. PMID: 39864959 Free PMC article.
References
-
- Légaré F., Stacey D., Turcotte S., Cossi M.-J., Kryworuchko J., Graham I.D., Lyddiatt A., Politi M.C., Thomson R., Elwyn G., et al. Interventions for Improving the Adoption of Shared Decision Making by Healthcare Professionals. Cochrane Database Syst. Rev. 2014;9:CD006732. doi: 10.1002/14651858.CD006732.pub3. - DOI - PubMed
LinkOut - more resources
Full Text Sources
