. 2023 Jan 25;14(2):315.
doi: 10.3390/genes14020315.

Comparative and Functional Analysis of miRNAs and mRNAs Involved in Muscle Fiber Hypertrophy of Juvenile and Adult Goats

Affiliations

Comparative and Functional Analysis of miRNAs and mRNAs Involved in Muscle Fiber Hypertrophy of Juvenile and Adult Goats

Sanbao Zhang et al. Genes (Basel). .

Abstract

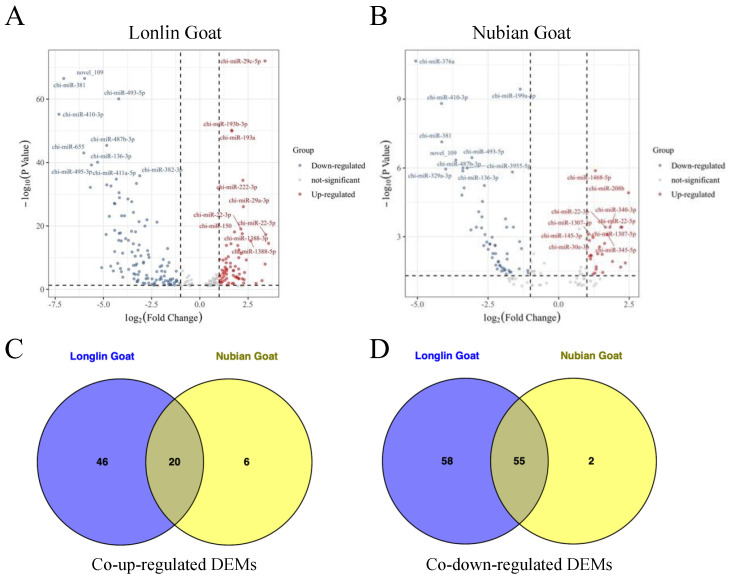
MicroRNAs (miRNAs) are small non-coding RNAs that post-transcriptionally regulate several pathway intermediates and affect the skeletal muscle development in mice, pigs, sheep, and cattle. However, to date, only a small number of miRNAs have been reported in the muscle development of goats. In this report, the longissimus dorsi transcripts of one- and ten-month-old goats were analyzed by sequencing RNAs and miRNAs. The results showed that the ten-month-old Longlin goats had 327 up- and 419 down-regulated differentially expressed genes (DEGs) compared with the one-month-old. In addition, 20 co-up-regulated and 55 co-down-regulated miRNAs involved in the muscle fiber hypertrophy of goats were identified in ten-month-old Longlin and Nubian goats compared with one-month-old. Five miRNA-mRNA pairs (chi-let-7b-3p-MIRLET7A, chi-miR193b-3p-MMP14, chi-miR-355-5p-DGAT2, novel_128-LOC102178119, novel_140-SOD3) involved in the goat skeletal muscle development were identified by miRNA-mRNA negative correlation network analysis. Our results provided new insight into the functional roles of goat muscle-associated miRNAs, allowing a deeper understanding of the transformation of miRNA roles during mammalian muscle development.

Keywords: goat; hypertrophy; mRNA; miRNA; muscle fiber.


Conflict of interest statement

The authors declare no conflict of interest.

Figures

Figure 1
Figure 1
The characteristic of muscle fibers for longissimus dorsi between 10-month-old and 1-month-old Longlin goat. (A) ATPase staining of longissimus dorsi between 10-month-old and 1-month-old Longlin goat. Type I is light gray or colorless (yellow arrow), type II is dark gray or black (red arrow). (B) Statistics of fiber types for longissimus dorsi between 10-month-old and 1-month-old Longlin goat. (C) H&E staining of longissimus dorsi between 10-month-old and 1-month-old Longlin goat. (D) Statistics of fiber cross-sectional area for longissimus dorsi between 10-month-old and 1-month-old Longlin goat. H&E staining: hematoxylin-eosin staining; ATPase Staining: Adenosine Triphosphatase Staining.
Figure 2
Figure 2
Differential expression analysis of mRNAs in longissimus dorsi between 1-month-old and 10-month-old Longlin goat. (A) Volcano plots of up-regulated and down-regulated DEGs of longissimus dorsi between 10-month-old and 1-month-old Longlin goat. The gray dots represent non-significantly DEGs, the 327 red dots represent significantly differentially up-regulated mRNAs, and the 419 blue dots represent significantly differentially down-regulated mRNAs. (B) GO analysis of DEGs of longissimus dorsi between 10-month-old and 1-month-old Longlin goat. Light green represents terms of up-regulated gene; Light red represents terms of down-regulated gene. (C) KEGG analysis of DEGs of longissimus dorsi between 10-month-old and 1-month-old Longlin goat. Light green represents terms of up-regulated genes; Light red represents terms of down-regulated genes. (D) RT-qPCR of DEGs compared with RNA-seq. Results of RT-qPCR analysis (Parallel analysis with RNA-seq results) of DEGs fold-change in longissimus dorsi between 10-month-old and 1-month-old Longlin goat. The relative expression of each mRNA was calculated using the 2−ΔΔct method. The data are presented as mean ± SEM from three independent experiments.
Figure 3
Figure 3
miRNA expression profiles in longissimus dorsi of goat. (A) Percentage distribution of all small RNA sequence lengths in longissimus dorsi of goat. (B) Characteristics of known and novel miRNAs in longissimus dorsi of goat. Small RNA classification was performed using the priority of “known miRNA > rRNA > tRNA > snRNA > snoRNA > repeat > gene > novel miRNA”.
Figure 4
Figure 4
Identification of DEMs between 1-month-old and 10-month-old Longlin and Nubian goat. (A) Volcano plots of up-regulated and down-regulated DEMs of longissimus dorsi between 10-month-old and 1-month-old Longlin goat. The gray dots represent non-significantly DEMs, the 66 red dots represent significantly differentially up-regulated miRNAs, and the 113 blue dots represent significantly differentially down-regulated miRNAs. (B) Volcano plots of up-regulated and down-regulated DEMs of longissimus dorsi between 10-month-old and 1-month-old Nubian goat. The gray dots represent non-significantly DEMs, the 26 red dots represent significantly differentially up-regulated miRNAs, and the 57 blue dots represent significantly differentially down-regulated miRNAs. (C) Venn diagram showing the intersection of the co-up-regulated DEMs between Longlin and Nubian goat. (D) Venn diagram showing the intersection of the co-down-regulated DEMs between Longlin and Nubian goat.
Figure 5
Figure 5
Function enrichment and joint analysis of DEMs and DEGs. (A) Function enrichment analysis of common DEM target genes in longissimus dorsi of goat. Light green represents terms of up-regulated miRNA target genes; Light red represents terms of down-regulated miRNA target genes. (B) The co-up-regulated miRNAs and target genes interaction networks in longissimus dorsi of goat. (C) The co-down-regulated miRNAs and target genes interaction networks in longissimus dorsi of goat. (D) miRNA–mRNA negative correlation network in longissimus dorsi of goat. The green arrow represents the down-regulated genes and miRNAs, and the red arrow represents up-regulated genes and miRNAs. (E) RT-qPCR of DEMs compared with RNA-seq. Results of RT-qPCR analysis (Parallel analysis with RNA-seq results) of DEMs fold-change in longissimus dorsi between Longlin. The relative expression of each miRNA was calculated using the 2−ΔΔct method. The data are presented as mean ± SEM from three independent experiments.

Similar articles

Cited by

References

    1. Silpa M., Naicy T., Aravindakshan T., Radhika G., Boswell A., Mini M. Sirtuin3 (SIRT3) gene molecular characterization and SNP detection in prolific and low prolific goat breeds. Theriogenology. 2018;122:47–52. doi: 10.1016/j.theriogenology.2018.09.008. - DOI - PubMed
    1. Aa A., Rdw A., Mh A., Frda B., Bjl A., Mz A., Aj A., Oa C., Ssc A. Effect of slaughter age and post-mortem days on meat quality of longissimus and semimembranosus muscles of Boer goats. Meat Sci. 2021;175:108466. - PubMed
    1. Shen J., Hao Z., Wang J., Hu J., Liu X., Li S., Ke N., Song Y., Lu Y., Hu L., et al. Comparative Transcriptome Profile Analysis of Longissimus dorsi Muscle Tissues From Two Goat Breeds With Different Meat Production Performance Using RNA-Seq. Front. Genet. 2021;11:619399. doi: 10.3389/fgene.2020.619399. - DOI - PMC - PubMed
    1. Óvilo C., Benítez R., Fernández A., Núñez Y., Ayuso M., Fernández A.I., Rodríguez C., Isabel B., Rey A.I., López-Bote C., et al. Longissimus dorsi transcriptome analysis of purebred and crossbred Iberian pigs differing in muscle characteristics. BMC Genom. 2014;15:413. doi: 10.1186/1471-2164-15-413. - DOI - PMC - PubMed
    1. Jia J., Lin M., Zhang L., York J.P., Zhang P. The Notch signaling pathway controls the size of the ocular lens by directly suppressing p57Kip2 expression. Mol. Cell Biol. 2007;27:7236–7247. doi: 10.1128/MCB.00780-07. - DOI - PMC - PubMed

Publication types