Meta-Analysis
. 2023 Feb 4;14(2):411.
doi: 10.3390/genes14020411.

Transient Receptor Potential Ankyrin 1 (TRPA1) Methylation and Chronic Pain: A Systematic Review

Affiliations
Meta-Analysis

Transient Receptor Potential Ankyrin 1 (TRPA1) Methylation and Chronic Pain: A Systematic Review

Fulvio Celsi et al. Genes (Basel). .

Abstract

Background and objective: Chronic pain represents a major global health issue in terms of psycho-physiological, therapeutic, and economic burden, not limited to adults but also to the pediatric age. Despite its great impact, its molecular mechanisms have still not been completely unraveled. Focusing on the impact of epigenetics in the pain complex trait, we assessed the association between chronic pain and the methylation pattern of TRPA1, a key gene related to pain sensitivity.

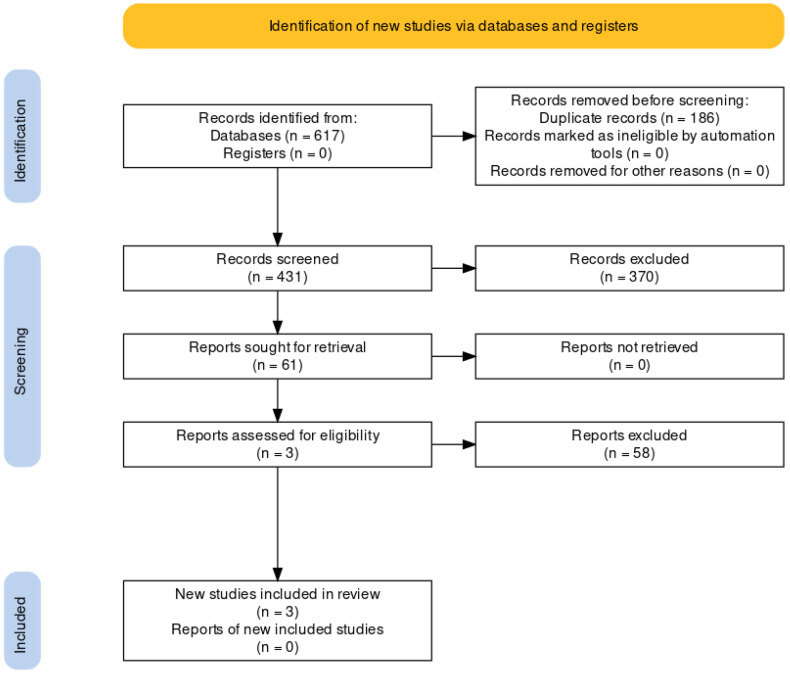
Methods: We conducted a systematic review retrieving articles from three different databases. After deduplication, 431 items were subjected to manual screening, and then 61 articles were selected and screened again. Of these, only six were maintained for meta-analysis and analyzed using specific R packages.

Results: Six articles were divided into two groups (group 1: comparison of mean methylation levels between healthy subjects and patients with chronic pain; group 2: correlation between mean methylation levels and pain sensation). A non-significant mean difference was obtained from the analysis of group 1 with a value of 3.97 (95% C.I. -7.79; 15.73). Analysis of group 2 showed a high level of variability between studies (correlation = 0.35, 95% C.I. -0.12; 0.82) due to their heterogeneity (I2 = 97%, p < 0.01).

Conclusions: Despite the high variability observed in the different studies analyzed, our results suggest that hypermethylation and increased pain sensitivity could be connected, possibly due to the variation of TRPA1 expression.

Keywords: TRPA1; methylation; pain.


Conflict of interest statement

The authors declare no conflict of interest.

Figures

Figure 1
Figure 1
PRISMA flow diagram of the procedures made to extract the works evaluated.
Figure 2
Figure 2
Evaluation of the risk of bias using the Q-Genie tool and presented as single and aggregated results. (a) risk of bias in each separated study presented for each single item, and overall (last column, Overall). (b) Aggregated results for every single item describing the risk of bias for the studies examined.
Figure 3
Figure 3
Random effect model analysis of group 1 papers. Study: the first author followed by the year of the study examined. Experimental/Control: data for affected/control groups. Total: number of subjects in each group. Mean: mean value of methylation level for each group. SD: standard deviation. Standardized mean difference: a graph showing the standardized mean differences for each study, with confidence intervals (grey squares). SMD: standardized mean difference value. A 95%-CI: confidence interval for 95% on SMD. Weight: statistical “weight” for each study. In bold characters, results from random effect model analysis are indicated as a graphical diamond on the standardized mean difference graph. Heterogeneity: results from heterogeneity test, I2, describes the percentage of variation across studies that is due to heterogeneity rather than chance, p: p-value derived from Cochran’s Q test.
Figure 4
Figure 4
Random effect model analysis of group 1 papers, excluding Achenbach et al., 2019. Study: the first author followed by the year of the study examined. Experimental/Control: data for affected/control groups. Total: number of subjects in each group. Mean: mean value of methylation level for each group. SD: standard deviation. Standardized mean difference: a graph showing the standardized mean differences for each study with confidence intervals (grey squares). SMD: standardized mean difference value. A 95%-CI: confidence interval for 95% on SMD. Weight: statistical “weight” for each study. In bold characters, results from random effect model analysis are indicated as a graphical diamond on the standardized mean difference graph. Heterogeneity: results from heterogeneity test, I2, describes the percentage of variation across studies that is due to heterogeneity rather than chance, p: p-value derived from Cochran’s Q test.
Figure 5
Figure 5
Random effect model analysis of group 2’s papers. Study: the first author followed by the year of the study examined. Total: total number of subjects in each group. COR: correlation (extracted from study) between pain sensations and methylation levels, with confidence intervals (grey squares). A 95%-CI: confidence interval for 95% on COR. Weight: statistical “weight” for each study. In bold characters, results from random effect model analysis are indicated as a graphical diamond on correlation graph. Heterogeneity: results from heterogeneity test, I2, describes the percentage of variation across studies that is due to heterogeneity rather than chance, p: p-value derived from Cochran’s Q test.
Figure 6
Figure 6
Random effect model analysis of group 2’s papers excluding Gombert (2017). Study: the first author followed by the year of the study examined. Total: total number of subjects in each group. COR: correlation (extracted from the study) between pain sensations and methylation levels with confidence intervals (grey squares). A 95%-CI: confidence interval for 95% on COR. Weight: statistical “weight” for each study. In bold characters, results from random effect model analysis are indicated as a graphical diamond on the correlation graph. Heterogeneity: results from heterogeneity test, I2, describes the percentage of variation across studies that is due to heterogeneity rather than chance, p: p-value derived from Cochran’s Q test.
Figure 7
Figure 7
Random effect model analysis of group 2 papers excluding Bell (2014). Study: the first author followed by the year of the study examined. Total: total number of subjects in each group. COR: correlation (extracted from the study) between pain sensations and methylation levels with confidence intervals (grey squares). A 95%-CI: confidence interval for 95% on COR. Weight: Statistical “weight” for each study. In bold characters, results from random effect model analysis are indicated as a graphical diamond on the correlation graph. Heterogeneity: results from heterogeneity test, I2, describes the percentage of variation across studies that is due to heterogeneity rather than chance, p: p-value derived from Cochran’s Q test.

Similar articles

Cited by

References

    1. Cohen S.P., Vase L., Hooten W.M. Chronic Pain: An Update on Burden, Best Practices, and New Advances. Lancet. 2021;397:2082–2097. doi: 10.1016/S0140-6736(21)00393-7. - DOI - PubMed
    1. King S., Chambers C.T., Huguet A., MacNevin R.C., McGrath P.J., Parker L., MacDonald A.J. The Epidemiology of Chronic Pain in Children and Adolescents Revisited: A Systematic Review. Pain. 2011;152:2729–2738. doi: 10.1016/j.pain.2011.07.016. - DOI - PubMed
    1. Tutelman P.R., Langley C.L., Chambers C.T., Parker J.A., Finley G.A., Chapman D., Jones G.T., Macfarlane G.J., Marianayagam J. Epidemiology of Chronic Pain in Children and Adolescents: A Protocol for a Systematic Review Update. BMJ Open. 2021;11:e043675. doi: 10.1136/bmjopen-2020-043675. - DOI - PMC - PubMed
    1. Fillingim R.B., Loeser J.D., Baron R., Edwards R.R. Assessment of Chronic Pain: Domains, Methods, and Mechanisms. J. Pain. 2016;17:T10–T20. doi: 10.1016/j.jpain.2015.08.010. - DOI - PMC - PubMed
    1. Bushnell M.C., Frangos E., Madian N. Non-Pharmacological Treatment of Pain: Grand Challenge and Future Opportunities. Front. Pain Res. 2021;2:696783. doi: 10.3389/fpain.2021.696783. - DOI - PMC - PubMed

Publication types