

Seasonal Oxy-Inflammation and Hydration Status in Non-Elite Freeskiing Racer: A Pilot Study by Non-Invasive Analytic Method
- PMID: 36833850
- PMCID: PMC9960265
- DOI: 10.3390/ijerph20043157
Seasonal Oxy-Inflammation and Hydration Status in Non-Elite Freeskiing Racer: A Pilot Study by Non-Invasive Analytic Method
Abstract
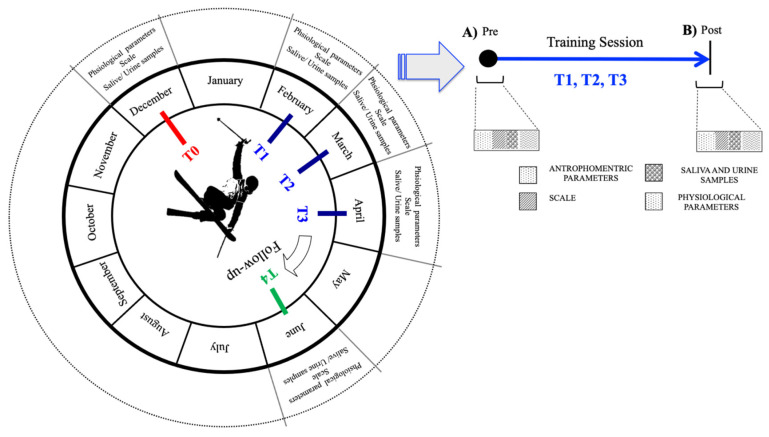
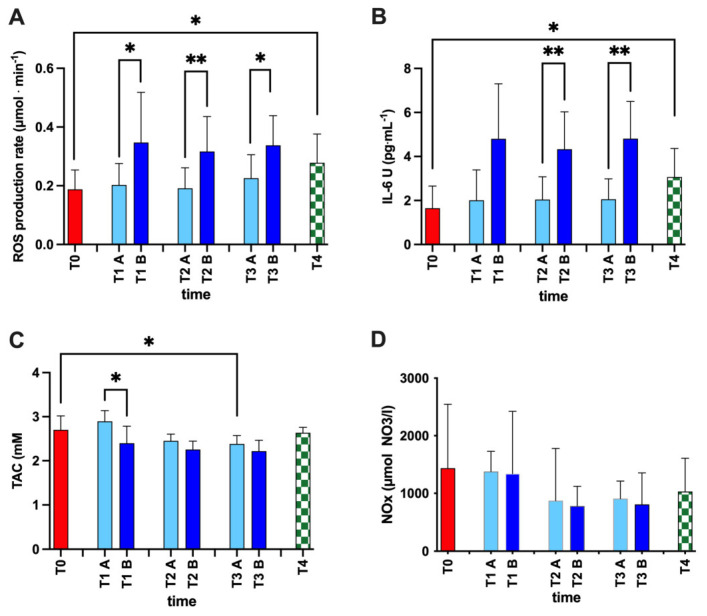
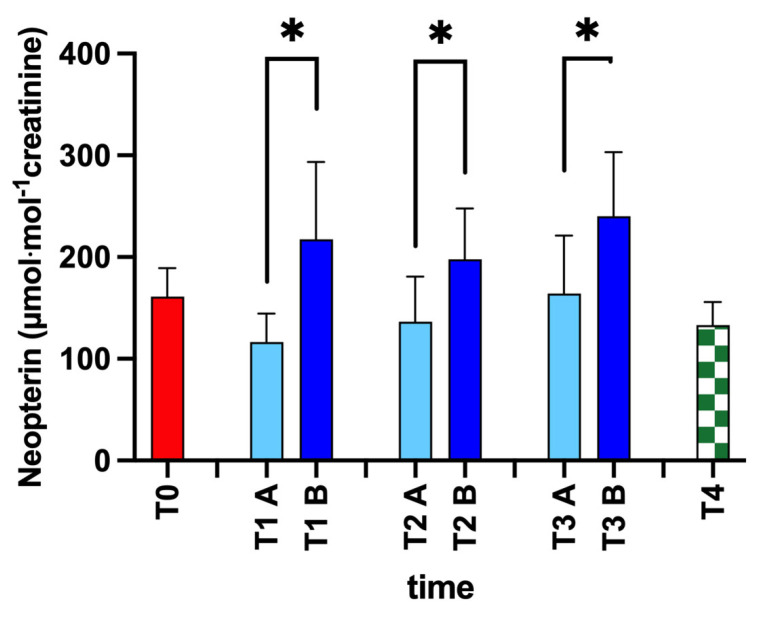
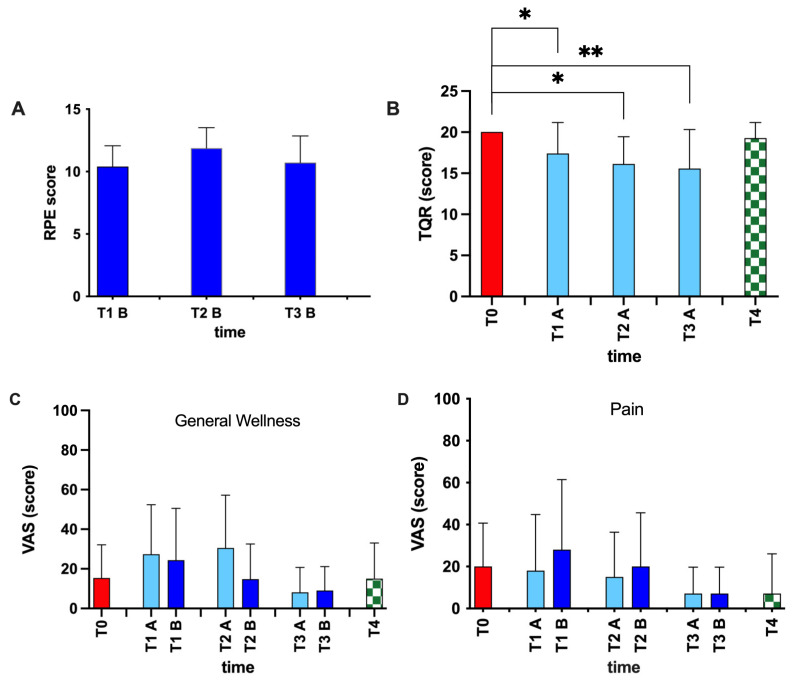
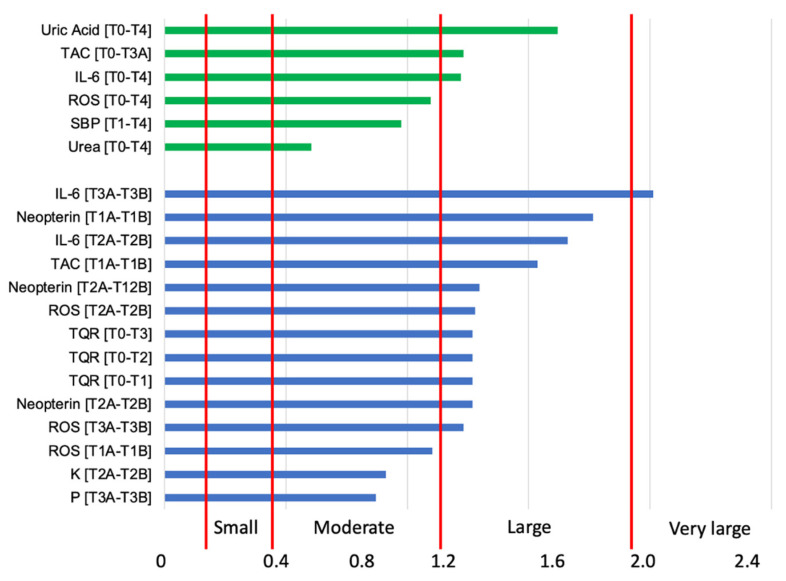
Freeskiing is performed in an extreme environment, with significant physical effort that can induce reactive oxygen species (ROS) generation and dehydration. This study aimed to investigate the evolution of the oxy-inflammation and hydration status during a freeskiing training season with non-invasive methods. Eight trained freeskiers were investigated during a season training: T0 (beginning), T1-T3 (training sessions), and T4 (after the end). Urine and saliva were collected at T0, before (A) and after (B) T1-T3, and at T4. ROS, total antioxidant capacity (TAC), interleukin-6 (IL-6), nitric oxide (NO) derivatives, neopterin, and electrolyte balance changes were investigated. We found significant increases in ROS generation (T1A-B +71%; T2A-B +65%; T3A-B +49%; p < 0.05-0.01) and IL-6 (T2A-B +112%; T3A-B +133%; p < 0.01). We did not observe significant variation of TAC and NOx after training sessions. Furthermore, ROS and IL-6 showed statistically significant differences between T0 and T4 (ROS +48%, IL-6 +86%; p < 0.05). Freeskiing induced an increase in ROS production, which can be contained by antioxidant defense activation, and in IL-6, as a consequence of physical activity and skeletal muscular contraction. We did not find deep changes in electrolytes balance, likely because all freeskiers were well-trained and very experienced.
Keywords: electron paramagnetic resonance; inflammation; mountain; oxidative stress; saliva; skiing; training; urine.
Conflict of interest statement
The authors declare no conflict of interest.
Figures
Similar articles
-
Effects of Mountain Ultra-Marathon Running on ROS Production and Oxidative Damage by Micro-Invasive Analytic Techniques.PLoS One. 2015 Nov 5;10(11):e0141780. doi: 10.1371/journal.pone.0141780. eCollection 2015. PLoS One. 2015. PMID: 26540518 Free PMC article.
-
Change in Oxidative Stress Biomarkers During 30 Days in Saturation Dive: A Pilot Study.Int J Environ Res Public Health. 2020 Sep 28;17(19):7118. doi: 10.3390/ijerph17197118. Int J Environ Res Public Health. 2020. PMID: 32998440 Free PMC article.
-
Redox status alterations during the competitive season in élite soccer players: focus on peripheral leukocyte-derived ROS.Intern Emerg Med. 2017 Sep;12(6):777-788. doi: 10.1007/s11739-017-1653-5. Epub 2017 Mar 30. Intern Emerg Med. 2017. PMID: 28361355
-
Relative impact of oxidative stress on male reproductive function.Curr Med Chem. 2001 Jun;8(7):851-62. doi: 10.2174/0929867013373039. Curr Med Chem. 2001. PMID: 11375755 Review.
-
Comparison of in vitro tests for antioxidant and immunomodulatory capacities of compounds.Phytomedicine. 2014 Jan 15;21(2):164-71. doi: 10.1016/j.phymed.2013.08.008. Epub 2013 Sep 14. Phytomedicine. 2014. PMID: 24041614 Review.
Cited by
-
Environmental study and stress-related biomarkers modifications in a crew during analog astronaut mission EMMPOL 6.Eur J Appl Physiol. 2025 Jan;125(1):209-221. doi: 10.1007/s00421-024-05575-3. Epub 2024 Sep 25. Eur J Appl Physiol. 2025. PMID: 39320485 Free PMC article.
-
Consumption of Sylimarin, Pyrroloquinoline Quinone Sodium Salt and Myricetin: Effects on Alcohol Levels and Markers of Oxidative Stress-A Pilot Study.Nutrients. 2024 Sep 3;16(17):2965. doi: 10.3390/nu16172965. Nutrients. 2024. PMID: 39275279 Free PMC article. Clinical Trial.
-
Hyperbaric Oxygen Therapy Counters Oxidative Stress/Inflammation-Driven Symptoms in Long COVID-19 Patients: Preliminary Outcomes.Metabolites. 2023 Sep 25;13(10):1032. doi: 10.3390/metabo13101032. Metabolites. 2023. PMID: 37887357 Free PMC article.
-
Oxy-Inflammation in Humans during Underwater Activities.Int J Mol Sci. 2024 Mar 6;25(5):3060. doi: 10.3390/ijms25053060. Int J Mol Sci. 2024. PMID: 38474303 Free PMC article. Review.
-
Decompression Illness After Technical Diving Session in Mediterranean Sea: Oxidative Stress, Inflammation, and HBO Therapy.Int J Mol Sci. 2024 Oct 22;25(21):11367. doi: 10.3390/ijms252111367. Int J Mol Sci. 2024. PMID: 39518919 Free PMC article.
