. 2023 Feb 4;24(4):3085.
doi: 10.3390/ijms24043085.

COBL, MKX and MYOC Are Potential Regulators of Brown Adipose Tissue Development Associated with Obesity-Related Metabolic Dysfunction in Children

Affiliations

COBL, MKX and MYOC Are Potential Regulators of Brown Adipose Tissue Development Associated with Obesity-Related Metabolic Dysfunction in Children

Sarah Abdul Majeed et al. Int J Mol Sci. .

Abstract

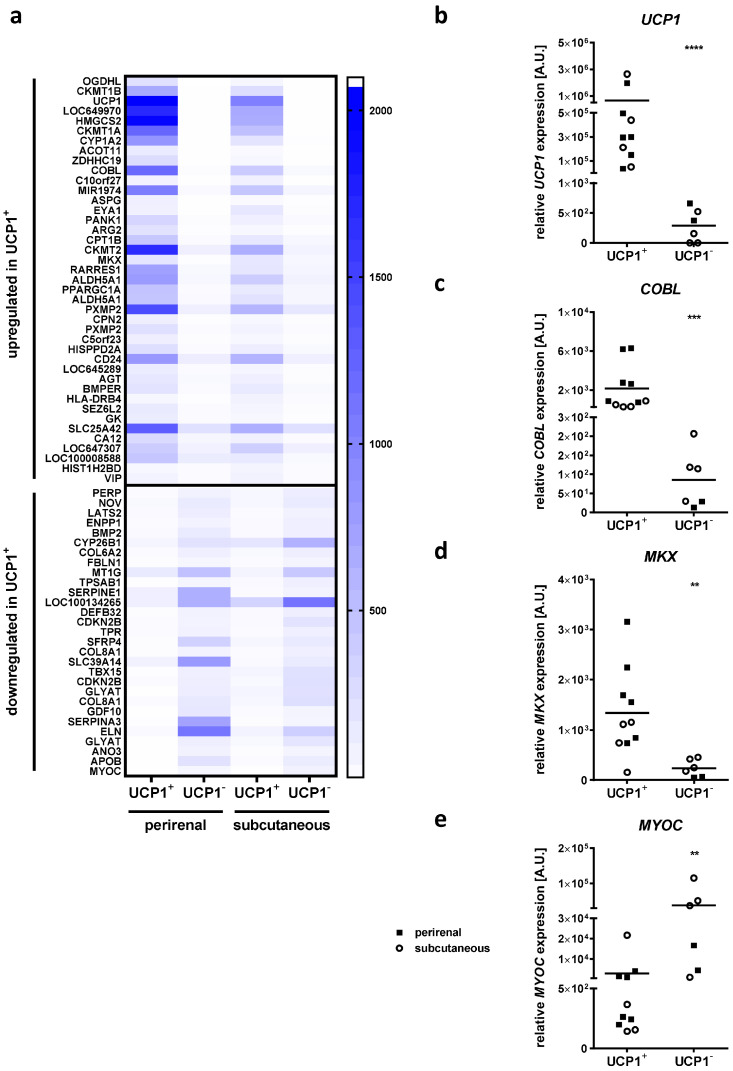
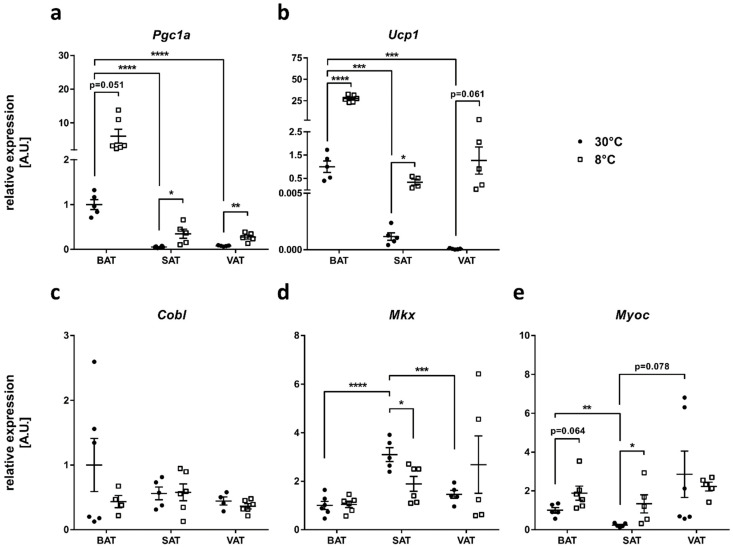
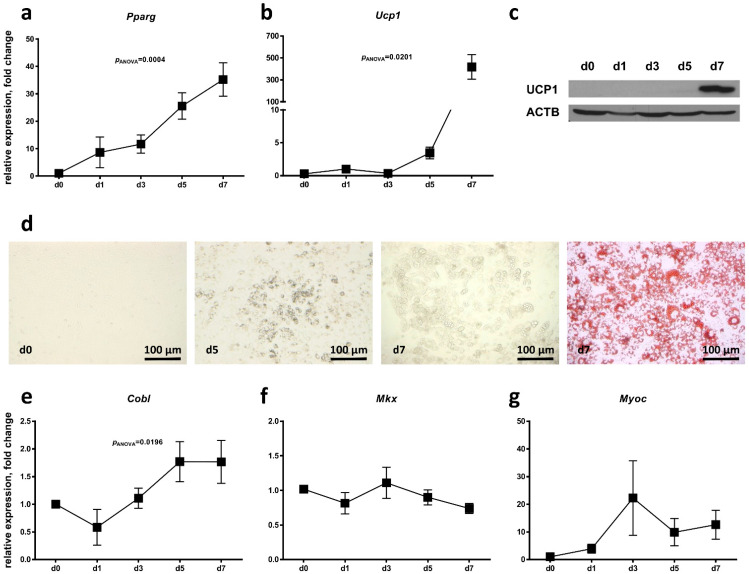
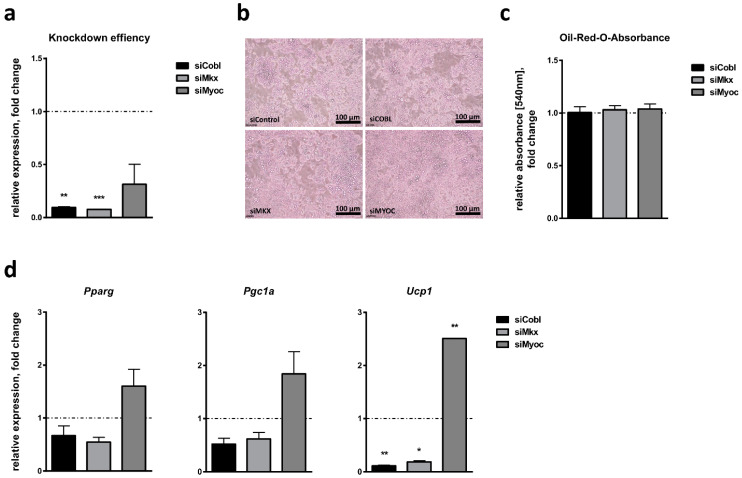
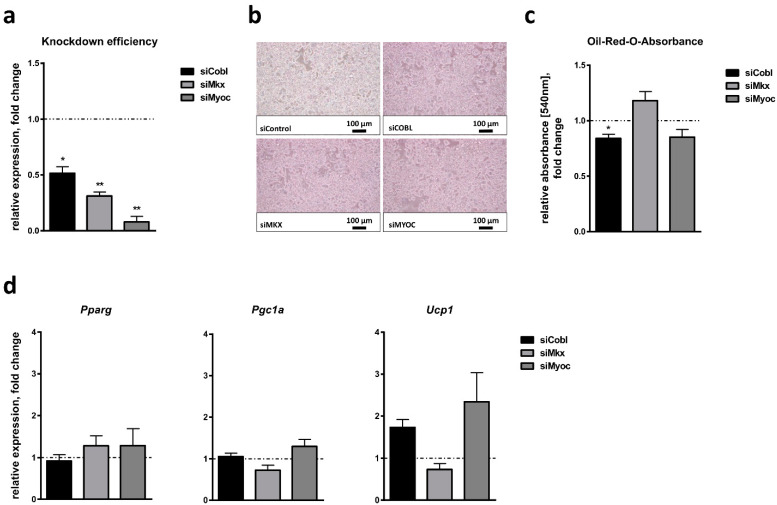
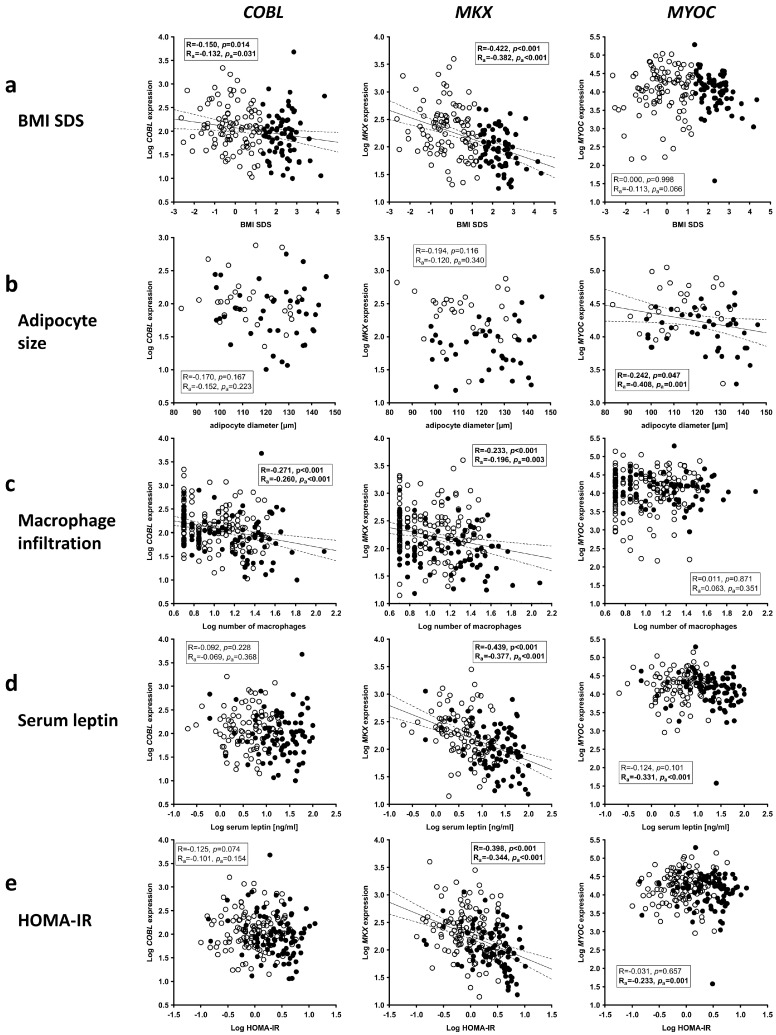
Obesity is already accompanied by adipose tissue (AT) dysfunction and metabolic disease in children and increases the risk of premature death. Due to its energy-dissipating function, brown AT (BAT) has been discussed as being protective against obesity and related metabolic dysfunction. To analyze the molecular processes associated with BAT development, we investigated genome-wide expression profiles in brown and white subcutaneous and perirenal AT samples of children. We identified 39 upregulated and 26 downregulated genes in uncoupling protein 1 (UCP1)-positive compared to UCP1-negative AT samples. We prioritized for genes that had not been characterized regarding a role in BAT biology before and selected cordon-bleu WH2 repeat protein (COBL), mohawk homeobox (MKX) and myocilin (MYOC) for further functional characterization. The siRNA-mediated knockdown of Cobl and Mkx during brown adipocyte differentiation in vitro resulted in decreased Ucp1 expression, while the inhibition of Myoc led to increased Ucp1 expression. Furthermore, COBL, MKX and MYOC expression in the subcutaneous AT of children is related to obesity and parameters of AT dysfunction and metabolic disease, such as adipocyte size, leptin levels and HOMA-IR. In conclusion, we identify COBL, MKX and MYOC as potential regulators of BAT development and show an association of these genes with early metabolic dysfunction in children.

Keywords: COBL; MKX; MYOC; adipocyte differentiation; adipose tissue; brown adipose tissue; children; metabolic disease; obesity; white adipose tissue.


Conflict of interest statement

The authors do not claim any conflict of interest or competing financial interest.

Figures

Figure 1
Figure 1
Identification of COBL, MKX and MYOC as regulated genes in brown vs. white children’s adipose tissue (AT) samples. (a) Heat map of transcriptome-based expression levels of up- and downregulated genes in perirenal and subcutaneous AT samples positive for the brown adipocyte marker uncoupling protein 1 (UCP1) in histological analyses (UCP1+) compared to histologically negative (UCP1) AT samples. Mean over all analyzed samples per group is shown. Expression of (b) UCP1 as well as the candidate genes (c) cordon-bleu WH2 repeat protein (COBL), (d) mohawk homeobox (MKX) and (e) myocilin (MYOC) in UCP1+ AT samples was compared to that of UCP1 AT samples using quantitative real-time PCR. Six available perirenal UCP1+ AT samples were compared to the 2 available perirenal UCP1 samples. Four available subcutaneous UCP1+ AT samples were compared to 4 subcutaneous UCP1 samples matched for similar age, sex and BMI SDS of probands. Scatter dot plots show individual samples grouped into perirenal (filled square) and subcutaneous (open circle) AT samples. The grand mean over all samples is indicated by a horizontal line. Statistical analyses were performed using Student’s t-test and significant p-values are indicated. ** p < 0.01; *** p < 0.001; **** p < 0.0001.
Figure 2
Figure 2
Effect of cold exposure on expression of the candidate genes Cobl, Mkx and Myoc in different adipose tissue (AT) depots of mice. Relative expression of the brown adipocyte marker genes (a) peroxisome proliferator-activated receptor gamma coactivator 1-alpha (Pgc1a) and (b) uncoupling protein 1 (Ucp1) as well as the candidate genes (c) cordon-bleu WH2 repeat protein (Cobl), (d) mohawk homeobox (Mkx) and (e) myocilin (Myoc) in brown AT (BAT), subcutaneous AT (SAT, inguinal white AT (WAT)) and visceral AT (VAT, epigonadal WAT) was compared between mice either kept at thermoneutrality (30 °C) or subjected to cold exposure (8 °C) for a period of 7 days. Data of four to six mice per group are presented as fold change compared to BAT expression levels at 30 °C and are given as mean ± SEM. Statistical analyses were performed using Student’s t-test and significant p-values are indicated. * p < 0.05; ** p < 0.01; *** p < 0.001; **** p < 0.0001.
Figure 3
Figure 3
Regulation of candidate gene expression during brown adipocyte differentiation of HIB1B cells. HIB1B cells were subjected to adipocyte differentiation for a period of 7 days. Relative expression of the marker genes (a) peroxisome proliferator-activated receptor gamma (Pparg) and (b) uncoupling protein 1 (Ucp1) was measured to verify efficient differentiation into brown adipocytes. (c) UCP1 protein levels of one exemplary experiment were analyzed by immunoblot at different time points of brown adipocyte differentiation. Detection of β-Actin (ACTB) served as loading control. (d) Microscopic bright-field images of HIB1B cells before adipogenic induction (day 0) and on days 5 and 7 of adipocyte differentiation. Lipid accumulation in differentiated HIB1B cells was visualized by Oil-Red-O staining. Relative expression of the candidate genes (e) cordon-bleu WH2 repeat protein (Cobl), (f) mohawk homeobox (Mkx) and (g) myocilin (Myoc) was analyzed before adipogenic induction (day 0) and at different time points of brown adipocyte differentiation. Data are compared to day 0 and presented as mean ± SEM of five independent experiments each measured in triplicate. Significant p-values determined by one-way ANOVA are given.
Figure 4
Figure 4
Effect of candidate gene knockdown on brown adipocyte differentiation of HIB1B cells. (a) Cordon-bleu WH2 repeat protein (Cobl), mohawk homeobox (Mkx) and myocilin (Myoc) expression was analyzed 48 h after siRNA-mediated candidate gene knockdown and directly before adipogenic induction (day 0). (b) Microscopic bright-field images of HIB1B cells treated with the indicated siRNAs on day 7 of brown adipocyte differentiation. (c) Lipid accumulation as a measure of adipogenic capacity was quantified by Oil-Red-O staining and absorbance measurement. (d) Relative expression of the adipogenic marker genes peroxisome proliferator-activated receptor gamma (Pparg), peroxisome proliferator-activated receptor gamma coactivator 1-alpha (Pgc1a) and uncoupling protein 1 (Ucp1) was measured on day 7 of adipocyte differentiation. Bar plots represent mean ± SEM of the two independent experiments compared to cells treated with control siRNA (dotted line), each measured in triplicate. Significant p-values (Student’s t-test) are indicated. * p < 0.05; **, p < 0.01; *** p < 0.001.
Figure 5
Figure 5
Regulation of candidate gene expression during white adipocyte browning of 3T3-L1 cells. 3T3-L1 cells were subjected to adipocyte differentiation and white adipocyte browning using either rosiglitazone or bone morphogenetic protein 7 (BMP7) for a period of 12 days. Efficient adipocyte differentiation was confirmed by (a) Oil-Red-O staining and subsequent (b) extraction and absorbance measurement. (c) Browning of white adipocytes was verified by immunoblot detection of the brown adipocyte marker uncoupling protein 1 (UCP1) in one exemplary experiment. Detection of β-Actin (ACTB) served as loading control. (d) Relative expression of the white and/or brown adipogenic marker genes peroxisome proliferator-activated receptor gamma (Pparg) and Ucp1 as well as the candidate genes cordon-bleu WH2 repeat protein (Cobl), mohawk homeobox (Mkx) and myocilin (Myoc) was analyzed at different time points of adipocyte differentiation. Data are given as mean ± SEM of the three independent experiments each measured in triplicate. Significant p-values (determined by two-way ANOVA and Sidak’s multiple comparison test) for differences between treated cells and control cells are indicated. * p < 0.05; ** p < 0.01; *** p < 0.001; **** p < 0.0001.
Figure 6
Figure 6
Effect of candidate gene knockdown on white adipocyte browning of 3T3-L1 cells. (a) Cordon-bleu WH2 repeat protein (Cobl), mohawk homeobox (Mkx) and myocilin (Myoc) expression was analyzed 48 h after siRNA-mediated candidate gene knockdown and directly before adipogenic induction (day 0). Adipocyte differentiation was performed in the presence of rosiglitazone as an inducer of adipocyte browning. (b) Microscopic bright-field images of 3T3-L1 cells treated with the indicated siRNAs on day 8 of adipocyte differentiation. (c) Lipid accumulation as a measure of adipogenic capacity was quantified by Oil-Red-O staining and absorbance measurement. (d) Relative expression of the white and/or brown adipogenic marker genes peroxisome proliferator-activated receptor gamma (Pparg), peroxisome proliferator-activated receptor gamma coactivator 1-alpha (Pgc1a) and uncoupling protein 1 (Ucp1) was measured on day 8 of adipocyte differentiation. Bar plots show results of the three independent experiments each measured in triplicate. Data are given as mean ± SEM compared to cells treated with control siRNA (dotted line). Significant p-values determined by Student’s t-test are indicated. * p < 0.05; ** p < 0.01.
Figure 7
Figure 7
Gene expression of candidate genes in adipose tissue (AT) of children and association with parameters of obesity and AT dysfunction. Cordon-bleu WH2 repeat protein (COBL), mohawk homeobox (MKX) and myocilin (MYOC) expression was analyzed in AT samples of children and an association with (a) BMI SDS, (b) adipocyte size, (c) AT macrophage infiltration, (d) serum leptin levels and (e) HOMA-IR was assessed. In each scatter plot, Pearson’s correlation coefficient and p-value are given two times, unadjusted (R, p) and adjusted for age and sex of children (Ra, pa). Significant results are indicated in bold. Lean children are represented as open, children with overweight and obesity as closed circles. BMI SDS, body mass index standard deviation score; HOMA-IR, homeostasis model assessment of insulin resistance.

Similar articles

Cited by

References

    1. Geserick M., Vogel M., Gausche R., Lipek T., Spielau U., Keller E., Pfäffle R., Kiess W., Körner A. Acceleration of BMI in Early Childhood and Risk of Sustained Obesity. N. Engl. J. Med. 2018;379:1303–1312. doi: 10.1056/NEJMoa1803527. - DOI - PubMed
    1. Cummins T.D., Holden C.R., Sansbury B.E., Gibb A.A., Shah J., Zafar N., Tang Y., Hellmann J., Rai S.N., Spite M., et al. Metabolic remodeling of white adipose tissue in obesity. Am. J. Physiol. Endocrinol. Metab. 2014;307:E262–E277. doi: 10.1152/ajpendo.00271.2013. - DOI - PMC - PubMed
    1. Vázquez-Vela M.E.F., Torres N., Tovar A.R. White Adipose Tissue as Endocrine Organ and Its Role in Obesity. Arch. Med. Res. 2008;39:715–728. doi: 10.1016/j.arcmed.2008.09.005. - DOI - PubMed
    1. Kahn C.R., Wang G., Lee K.Y. Altered adipose tissue and adipocyte function in the pathogenesis of metabolic syndrome. J. Clin. Investig. 2019;129:3990–4000. doi: 10.1172/JCI129187. - DOI - PMC - PubMed
    1. Saely C.H., Geiger K., Drexel H. Brown versus white adipose tissue: A mini-review. Gerontology. 2012;58:15–23. doi: 10.1159/000321319. - DOI - PubMed

Substances