. 2023 Feb 4;24(4):3094.
doi: 10.3390/ijms24043094.

Cardiac-Specific Expression of Cre Recombinase Leads to Age-Related Cardiac Dysfunction Associated with Tumor-like Growth of Atrial Cardiomyocyte and Ventricular Fibrosis and Ferroptosis

Affiliations

Cardiac-Specific Expression of Cre Recombinase Leads to Age-Related Cardiac Dysfunction Associated with Tumor-like Growth of Atrial Cardiomyocyte and Ventricular Fibrosis and Ferroptosis

Zhongguang Li et al. Int J Mol Sci. .

Abstract

Transgenic expression of Cre recombinase driven by a specific promoter is normally used to conditionally knockout a gene in a tissue- or cell-type-specific manner. In αMHC-Cre transgenic mouse model, expression of Cre recombinase is controlled by the myocardial-specific α-myosin heavy chain (αMHC) promoter, which is commonly used to edit myocardial-specific genes. Toxic effects of Cre expression have been reported, including intro-chromosome rearrangements, micronuclei formation and other forms of DNA damage, and cardiomyopathy was observed in cardiac-specific Cre transgenic mice. However, mechanisms associated with Cardiotoxicity of Cre remain poorly understood. In our study, our data unveiled that αMHC-Cre mice developed arrhythmias and died after six months progressively, and none of them survived more than one year. Histopathological examination showed that αMHC-Cre mice had aberrant proliferation of tumor-like tissue in the atrial chamber extended from and vacuolation of ventricular myocytes. Furthermore, the αMHC-Cre mice developed severe cardiac interstitial and perivascular fibrosis, accompanied by significant increase of expression levels of MMP-2 and MMP-9 in the cardiac atrium and ventricular. Moreover, cardiac-specific expression of Cre led to disintegration of the intercalated disc, along with altered proteins expression of the disc and calcium-handling abnormality. Comprehensively, we identified that the ferroptosis signaling pathway is involved in heart failure caused by cardiac-specific expression of Cre, on which oxidative stress results in cytoplasmic vacuole accumulation of lipid peroxidation on the myocardial cell membrane. Taken together, these results revealed that cardiac-specific expression of Cre recombinase can lead to atrial mesenchymal tumor-like growth in the mice, which causes cardiac dysfunction, including cardiac fibrosis, reduction of the intercalated disc and cardiomyocytes ferroptosis at the age older than six months in mice. Our study suggests that αMHC-Cre mouse models are effective in young mice, but not in old mice. Researchers need to be particularly careful when using αMHC-Cre mouse model to interpret those phenotypic impacts of gene responses. As the Cre-associated cardiac pathology matched mostly to that of the patients, the model could also be employed for investigating age-related cardiac dysfunction.

Keywords: atrial tumors; calcium channel; cardiac-specific Cre; ferroptosis; heart failure; matrix metalloproteinases; myocardial intercalated discs.


Conflict of interest statement

The authors declare no conflict of interest.

Figures

Figure 1
Figure 1
αMHC-Cre mice displayed progressive death accompanied with arrhythmia and cardiomyopathy at six months of age. (A) Kaplan–Meier survival curve analysis of αMHC-Cre compared to WT mice. αMHC-Cre mice began dying at 6 months, dropping off intermittently until 12 months of age (n = 19 mice per group). (B) Representative surface ECG signals were recorded from WT and αMHC-Cre mice at the age of six months. The ECG from the αMHC-Cre mice showed longer 2nd degree AV block (arrow). (C,D) Representative electrocardiograms detected from αMHC-Cre mouse showed disordered RR intervals compared to WT mice. (E,F) Heart rate (E) and the ECG parameters (F) obtained in WT (n = 19) and αMHC-Cre mice (n = 24). (G,H) Serum levels of LDH (G) and CK-MB (H) were measured in WT and αMHC-Cre mice at 6 months of age (n = 6 mice per group). RR interval: the time between QRS complexes. In panels (C,E,F), each dot represents one individual. Statistical significance was determined using two-tailed Student’s t-tests. ns: no significant. ** p < 0.01, *** p < 0.001, **** p < 0.0001.
Figure 2
Figure 2
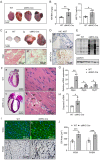
Tumor-like atrium and cardiomyocyte death lead to cardiac remodeling and heart failure in αMHC-Cre mice at six months of age. (A) Representative morphological images of the heart from WT and αMHC-Cre mice at six months of age. Scale bar, 4 mm. (B) Summary of the HW/BW and HW/TL ratio (n = 6 mice per group). (C) Representative left atrium morphological images were obtained from WT (a) and αMHC-Cre mice at six months of age (b) and sections stained with H&E (c,d). (D) Representative images of Ki67-stained left atrium sections from WT (a) and αMHC-Cre (b) mice. (E) Ki67 protein level of left atrium was measured by Western blot. (F) Left, H&E staining of heart sections from WT (a) and αMHC-Cre mice at six months of age (c). Scale bars, 2 mm. Right, higher magnification images of left ventricular sections stained with H&E from WT (b) and αMHC-Cre mice at six months of age (d). Cytoplasmic vacuolation of myofibers was present (arrow) in left ventricular of αMHC-Cre mice (d). Scale bars, 25 μm. (G) Nppa, Nppb and Myh7 mRNA were measured by real-time PCR in left ventricle of WT and αMHC-Cre mice at six months of age. Gene expression changes were presented as a fold change relative to WT mice (n = 4 mice per group). (H) Left ventricle Caspase3 mRNA was measured by real-time PCR in WT and αMHC-Cre mice at six months of age. Gene expression changes were presented as a fold change relative to WT mice (n = 4 mice per group). (I) Representative images of WGA (a,b) and PASM staining (c,d) staining for heart cross-sections from WT and αMHC-Cre mice. (J) Cardiomyocyte cross-sectional areas assessed using ImageJ. For (B,G,H,J), each dot represents one individual. Statistical significance was determined using two-tailed Student’s t-tests. * p < 0.05, ** p < 0.01, *** p < 0.01.
Figure 3
Figure 3
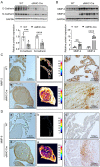
Abnormal expression of tumor-associated proteins in left atrium of αMHC-Cre mice at six months of age. (A) Western blots and quantification of E-Cadherin and N-Cadherin levels in left atrium (normalized to GAPDH) from six-months-old WT and αMHC-Cre mice. (B) Western blots and quantification of MMP-2 and MMP-9 levels in left atrium (normalized to GAPDH) from six-months-old WT and αMHC-Cre mice. (C) The left panel is a representative image of MMP-2 IHC staining in left atrium from WT (a) and αMHC-Cre (d) mice at six months of age. The middle panel is a 3D surface plot of MMP-2 IHC staining (b,e). The right panel is a magnified image of MMP-2 staining (c,f). (D) The left panel is a representative image of MMP-9 IHC staining in the left atrium from WT (a) and αMHC-Cre (d) mice at six months of age. The middle panel is a 3D surface plot of MMP-9 IHC staining (b,e). The right panel is a magnified image of MMP-9 staining (c,f). Statistical significance was determined using two-tailed Student’s t-tests. ** p < 0.01, *** p < 0.001, **** p < 0.0001.
Figure 4
Figure 4
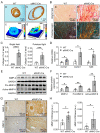
αMHC-Cre mice developed severe cardiac fibrosis with enhanced MMP-2 and MMP-9 level. (A) Representative Sirius red staining images of heart longitudinal sections (a,b) and their 3D surface plot (c,d) from six-months-old WT (a,c) and αMHC-Cre (b,d) mice. (B) Representative Sirius red-stained enlarged images using either brightfield (a,b) or polarized light microscopy (c,d) from six-months-old WT (a,c) and αMHC-Cre (b,d) mice. (C) Quantitative analysis of red stained area to assess fibrosis in (B). Quantitative analysis represents counting of multiple fields from 6 independent mice per group. (D) Relative mRNA levels of the cardiac fibrosis biomarkers Col1a1, Col3a1, and Tgfb in WT and αMHC-Cre mice at six months of age using real-time PCR. Gene expression changes are presented as a fold change relative to WT controls (n = 3 mice per group). (E,F) Western blots and quantification of MMP-2 and MMP-9 protein levels in left ventricle tissue (normalized to GAPDH) from six-months-old WT and αMHC-Cre mice. (G) Representative images of MMP-2 (a,b) and MMP-9 (c,d) immunohistochemical staining of left ventricle sections from six-months-old WT (a,c) and αMHC-Cre (b,d) mice. (H) MMP-2 and MMP-9 intensity was determined and quantified by Image J. For (C,D,F,H), each dot represents one individual. Statistical significance was determined using two-tailed Student’s t-tests. * p < 0.05, ** p < 0.01, *** p < 0.001, **** p < 0.0001.
Figure 5
Figure 5
Elevation of circulating MMP-2 and MMP-9 in αMHC-Cre mice is in consistence with that of patients’ samples with heart failure. (A,B) Western blots and quantification of MMP-2 (A) and MMP-9 (B) protein levels in serum (normalized to total; Red, ponceau S staining) from 6-months-old WT and αMHC-Cre mice. (C,D) Relative MMP-2 and MMP-9 mRNA expression in human normal heart tissue or heart failure (idiopathic or ischemic cardiomyopathy) samples based on Gene Expression Omnibus (GEO) database. GEO accession number were GSE5406 (C) and GSE57338 (D). In GSE5406 dataset: n (Normal: non-failing heart) = 16; n (Idiopathic failing heart) = 86; n (Ischemic failing heart) = 108. In GSE57338 dataset: n (Normal: non-failing heart) = 136; n (Idiopathic failing heart) = 82; n (Ischemic failing heart) = 95. ns: no significant. * p < 0.05, ** p < 0.01, *** p < 0.001, **** p <0.0001.
Figure 6
Figure 6
Cardiac-specific expression of Cre recombinase leads to dysregulated expression of gap junction proteins within intercalated disc and disorder of intracellular Ca2+ regulatory proteins. (A,B) Western blot and quantitative analysis of N-Cadherin, E-Cadherin and β-Catenin, which are components of the intercalated disc, and GAPDH as the loading control in left ventricular tissues derived from six-months-old WT and αMHC-Cre mice (n = 6–7 mice per group). (C) Representative immunofluorescence images of N-Cadherin (Red, a,d) localized to the intercalated disc in left ventricular from six-months-old WT (ac) and αMHC-Cre (df) mice. N-Cadherin is used as an intercalated disc marker. Nuclei (b,e): blue staining. White arrow: intercalated disc. Scale bar, 40 µm. (D) Quantitative statistics of N-Cadherin immunofluorescence staining in D by Image J. a.u., arbitrary units. (E,F) Western blot and quantitative analysis of CnA, RyR, IP3R3, SERCA2 and FKBP12 in left ventricular derived from six-months-old WT and αMHC-Cre mice. GAPDH as the loading control (n = 4 mice per group). For (B,D,F), each dot represents one individual. Statistical significance was determined using two-tailed Student’s t-tests. ns: no significant. * p < 0.05, *** p < 0.001, **** p <0.0001.
Figure 7
Figure 7
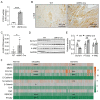
Ferroptosis signaling pathway is involved in Cre recombinase induced cardiotoxicity. (A) Relative levels of PTGS2 mRNA were measured in left ventricular from WT and αMHC-Cre mice at six months of age using real-time PCR. Gene expression changes are presented as a fold change relative to WT controls (n = 4 mice per group). (B) Representative images of 4-HNE immunohistochemical staining of left ventricular sections from six-months-old WT (a) and αMHC-Cre (b) mice. (C) 4-HNE intensity was determined and quantified by Image J. a.u., arbitrary units. (D,E) Western blot and quantitative analysis of Slc7a11, PTGS2 and 4-HNE, GAPDH as the loading control in left ventricular derived from six-months-old WT and αMHC-Cre mice (n = 6 mice per group). (F) Heat map of differential genes expression in human normal heart tissue or heart failure (idiopathic or ischemic cardiomyopathy) samples from GSE5406. n (Normal: non-failing heart) = 16; n (Idiopathic failing heart) = 86; n (Ischemic failing heart) = 108. For (A,C,E), each dot represents one individual. Statistical significance was determined using two-tailed Student’s t-tests. * p < 0.05, ** p < 0.01, *** p < 0.001, **** p < 0.0001.

Similar articles

Cited by

References

    1. Kim H., Kim M., Im S.K., Fang S. Mouse Cre-LoxP system: General principles to determine tissue-specific roles of target genes. Lab. Anim. Res. 2018;34:147–159. doi: 10.5625/lar.2018.34.4.147. - DOI - PMC - PubMed
    1. Zhang S., Li Y., Huang X., Liu K., Wang Q.D., Chen A.F., Sun K., Lui K.O., Zhou B. Seamless Genetic Recording of Transiently Activated Mesenchymal Gene Expression in Endothelial Cells During Cardiac Fibrosis. Circulation. 2021;144:2004–2020. doi: 10.1161/CIRCULATIONAHA.121.055417. - DOI - PubMed
    1. Jakab M., Rostalski T., Lee K.H., Mogler C., Augustin H.G. Tie2 Receptor in Tumor-Infiltrating Macrophages Is Dispensable for Tumor Angiogenesis and Tumor Relapse after Chemotherapy. Cancer Res. 2022;82:1353–1364. doi: 10.1158/0008-5472.CAN-21-3181. - DOI - PMC - PubMed
    1. Keuls R.A., Parchem R.J. Single-Cell Multiomic Approaches Reveal Diverse Labeling of the Nervous System by Common Cre-Drivers. Front. Cell. Neurosci. 2021;15:648570. doi: 10.3389/fncel.2021.648570. - DOI - PMC - PubMed
    1. Sauer B., Henderson N. Targeted insertion of exogenous DNA into the eukaryotic genome by the Cre recombinase. New Biol. 1990;2:441–449. - PubMed

Substances