. 2023 Feb 6;24(4):3204.
doi: 10.3390/ijms24043204.

Whole Transcriptome Analysis of Hypothalamus in Mice during Short-Term Starvation

Affiliations

Whole Transcriptome Analysis of Hypothalamus in Mice during Short-Term Starvation

Eun-Young Oh et al. Int J Mol Sci. .

Abstract

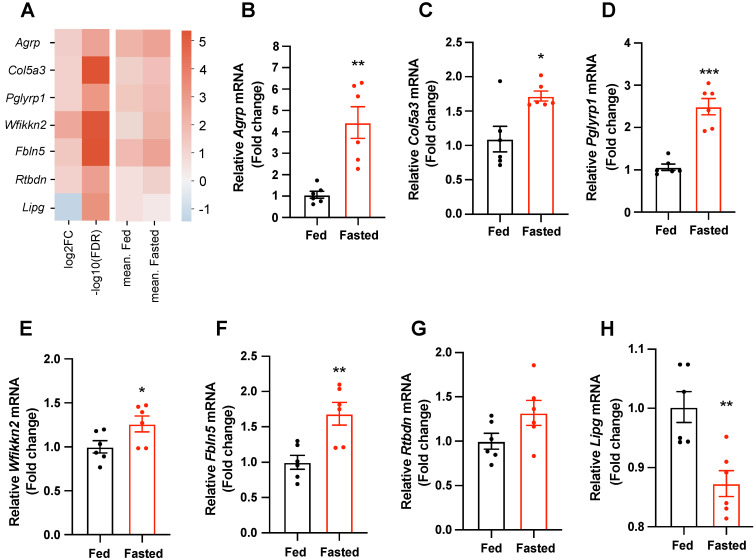
Molecular profiling of the hypothalamus in response to metabolic shifts is a critical cue to better understand the principle of the central control of whole-body energy metabolism. The transcriptional responses of the rodent hypothalamus to short-term calorie restriction have been documented. However, studies on the identification of hypothalamic secretory factors that potentially contribute to the control of appetite are lacking. In this study, we analyzed the differential expression of hypothalamic genes and compared the selected secretory factors from the fasted mice with those of fed control mice using bulk RNA-sequencing. We verified seven secretory genes that were significantly altered in the hypothalamus of fasted mice. In addition, we determined the response of secretory genes in cultured hypothalamic cells to treatment with ghrelin and leptin. The current study provides further insights into the neuronal response to food restriction at the molecular level and may be useful for understanding the hypothalamic control of appetite.

Keywords: RNA-seq; appetite; energy homeostasis; food deprivation; hypothalamus; secretory factor.


Conflict of interest statement

The authors declare no conflict of interest.

Figures

Figure 1
Figure 1
Overview of differential gene expression analysis between fed and fasted mice. (A) Venn diagram showing the number of overlapping genes between the hypothalamus and hippocampus regions in genes with false discovery rate (FDR) ≤ 0.05 and absolute log2 fold change (abs(log2FC)) > 1.0. (B) Heatmap demonstrating 70 differentially expressed genes (DEGs) with FDR ≤ 0.05 and abs(log2FC) > 1.0 in only hypothalamus, excluding 11 common genes between the hypothalamus and hippocampus. The genes annotated to the right of the heatmap are those with FDR ≤ 0.05 and abs(log2FC) > 1.5, and the blue color text represents the secretory-related gene. (C) Volcano plot depicting DEGs and distribution in hypothalamus compared with those of fed mice. The x-axis is log2FC of individual genes and y-axis is the negative logarithm of their FDR to base 10(−log10(FDR)). The black dots indicate genes with FDR > 0.05. The red dots indicate genes with FDR ≤ 0.05 and abs(log2FC) ≤ 1.0. The green dots indicate DEGs with FDR ≤ 0.05 and abs(log2FC) > 1.0 in fasted mice compared with those of fed mice. The blue dots indicate genes identified with FDR ≤ 0.05 and abs(log2FC) > 1.5, and secretory-related genes in fasted mice compared with those of fed mice. The blue color text represents the secretory-related gene.
Figure 2
Figure 2
Secretory-related genes are altered in the hypothalamus in response to short-term starvation. Analysis and validation of differentially expressed and secretory-related genes with FDR ≤ 0.05 and abs(log2FC) > 1.0 between the fed and fasted groups. (A) Heatmap representing DEGs. These genes encoded secretory signal peptides that were detected by at least three of the four methods (SignalP4, Phobius, TargetP, and WoLF PSORT) and were annotated to be “secreted” or “extracellular” in the subcellular location from the UniProtKB/Swiss-Prot dataset. Blue represents low expression, and red represents high expression in log2FC. (BF) The mRNA expression levels of Agrp, Col5a3, Pglyrp1, Wfikkn2, and Fbln5 were significantly elevated in hypothalamus of the fasted mice compared with those of fed control mice. (G) Rtbdn mRNA levels tended to be increased in hypothalamus of the fasted mice compared with those of fed control mice. (H) The mRNA level of Lipg was decreased in hypothalamus of the fasted mice compared with that of fed control mice. n = 6 mice/group. Data are presented as the mean ± SEM. * p < 0.05, ** p < 0.01, *** p < 0.001 vs. fed. p-values for unpaired comparisons were analyzed by two-tailed Student’s t-test.
Figure 3
Figure 3
Expression of secretory-related genes was altered by metabolic hormones in mHypoA cells. Quantitative real-time polymerase chain reaction analysis was performed to determine alterations in secretory-related gene expression in the leptin- or ghrelin-treated mHypoA cells. (A) The mRNA expression of Agrp was decreased by leptin treatment and upregulated by ghrelin treatment. (BE) The mRNA levels of Col5a3, Pglyrp1, Wfikkn2, and Fbln5 were increased by ghrelin treatment, but not altered by leptin treatment. (F) Rtbdn expression was not altered by leptin or ghrelin treatment. (G) The mRNA levels of Lipg were increased by leptin treatment and decreased by ghrelin treatment in mHypoA cells. n = 6/group. Data are presented as the mean ± SEM. * p < 0.05, ** p < 0.01, *** p < 0.001 vs. control. p-values for unpaired comparisons were analyzed by two-tailed Student’s t-test.
Figure 4
Figure 4
Identification of gene network. Networks obtained using IPA of 70 DEGs in only hypothalamus with FDR ≤ 0.05 and abs(log2FC) > 1.0 in fasted mice compared with those of fed mice. The networks with the highest score are exhibited. Genes in green were downregulated and red were upregulated. (A) The network with a score of 23 is associated with lipid metabolism, molecular transport, and small-molecule biochemistry, consisting of Angptl2, Aplnr, and Lipg. (B) The network with a score of 19 is associated with digestive system development and function, lipid metabolism, and molecular transport, consisting of Agrp and Npy.

References

    1. Xu Y., Nedungadi T.P., Zhu L., Sobhani N., Irani B.G., Davis K.E., Zhang X., Zou F., Gent L.M., Hahner L.D., et al. Distinct Hypothalamic Neurons Mediate Estrogenic Effects on Energy Homeostasis and Reproduction. Cell Metab. 2011;14:453–465. doi: 10.1016/j.cmet.2011.08.009. - DOI - PMC - PubMed
    1. Nestor C.C., Qiu J., Padilla S.L., Zhang C., Bosch M.A., Fan W., Aicher S.A., Palmiter R.D., Rønnekleiv O.K., Kelly M.J. Optogenetic Stimulation of Arcuate Nucleus Kiss1 Neurons Reveals a Steroid-Dependent Glutamatergic Input to POMC and AgRP Neurons in Male Mice. Mol. Endocrinol. 2016;30:630–644. doi: 10.1210/me.2016-1026. - DOI - PMC - PubMed
    1. Hashikawa K., Hashikawa Y., Tremblay R., Zhang J., Feng J.E., Sabol A., Piper W.T., Lee H., Rudy B., Lin D. Esr1 + Cells in the Ventromedial Hypothalamus Control Female Aggression. Nat. Neurosci. 2017;20:1580–1590. doi: 10.1038/nn.4644. - DOI - PMC - PubMed
    1. Yang T., Yang C.F., Chizari M.D., Maheswaranathan N., Burke K.J., Borius M., Inoue S., Chiang M.C., Bender K.J., Ganguli S., et al. Social Control of Hypothalamus-Mediated Male Aggression. Neuron. 2017;95:955–970. doi: 10.1016/j.neuron.2017.06.046. - DOI - PMC - PubMed
    1. Yu S., Qualls-Creekmore E., Rezai-Zadeh K., Jiang Y., Berthoud H.-R., Morrison C.D., Derbenev A.V., Zsombok A., Münzberg H. Glutamatergic Preoptic Area Neurons That Express Leptin Receptors Drive Temperature-Dependent Body Weight Homeostasis. J. Neurosci. 2016;36:5034–5046. doi: 10.1523/JNEUROSCI.0213-16.2016. - DOI - PMC - PubMed

LinkOut - more resources