. 2023 Feb 6;24(4):3210.
doi: 10.3390/ijms24043210.

Overexpression of Water-Responsive Genes Promoted by Elevated CO2 Reduces ROS and Enhances Drought Tolerance in Coffea Species

Affiliations

Overexpression of Water-Responsive Genes Promoted by Elevated CO2 Reduces ROS and Enhances Drought Tolerance in Coffea Species

Isabel Marques et al. Int J Mol Sci. .

Abstract

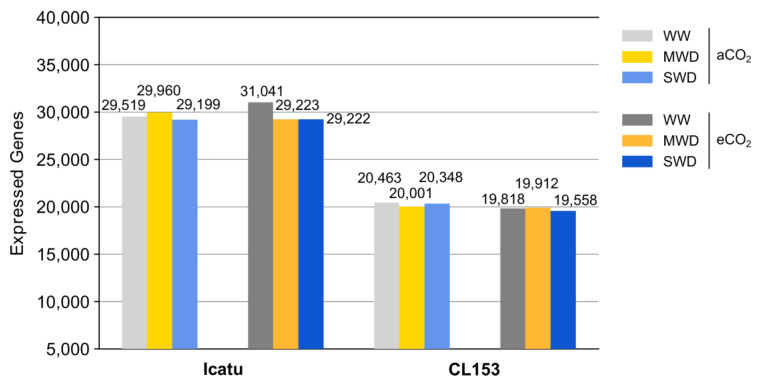
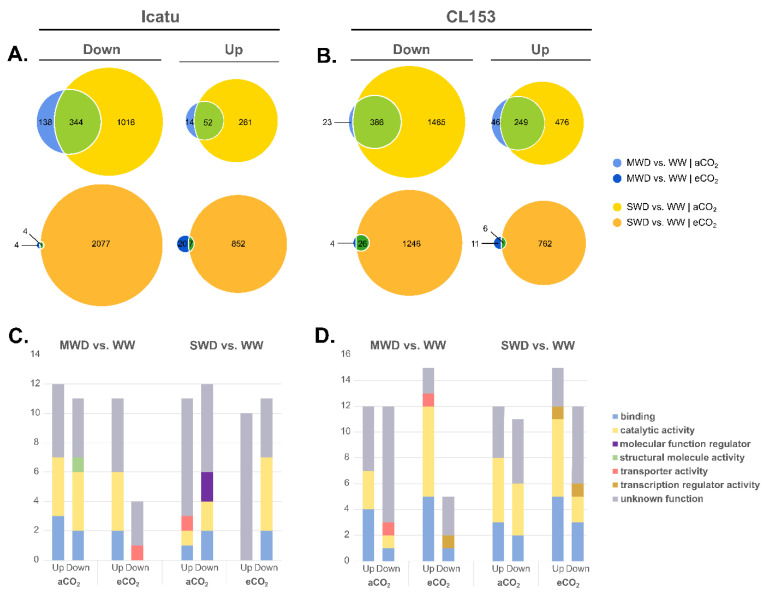
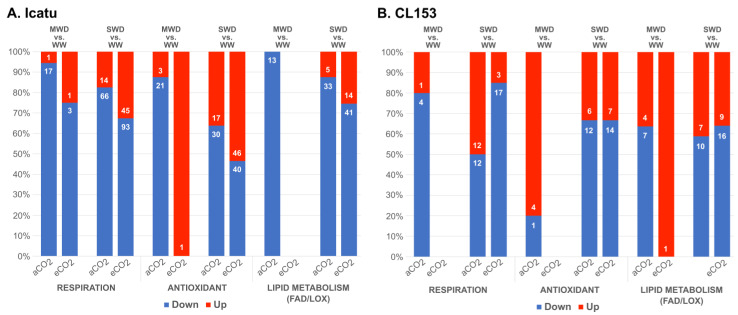
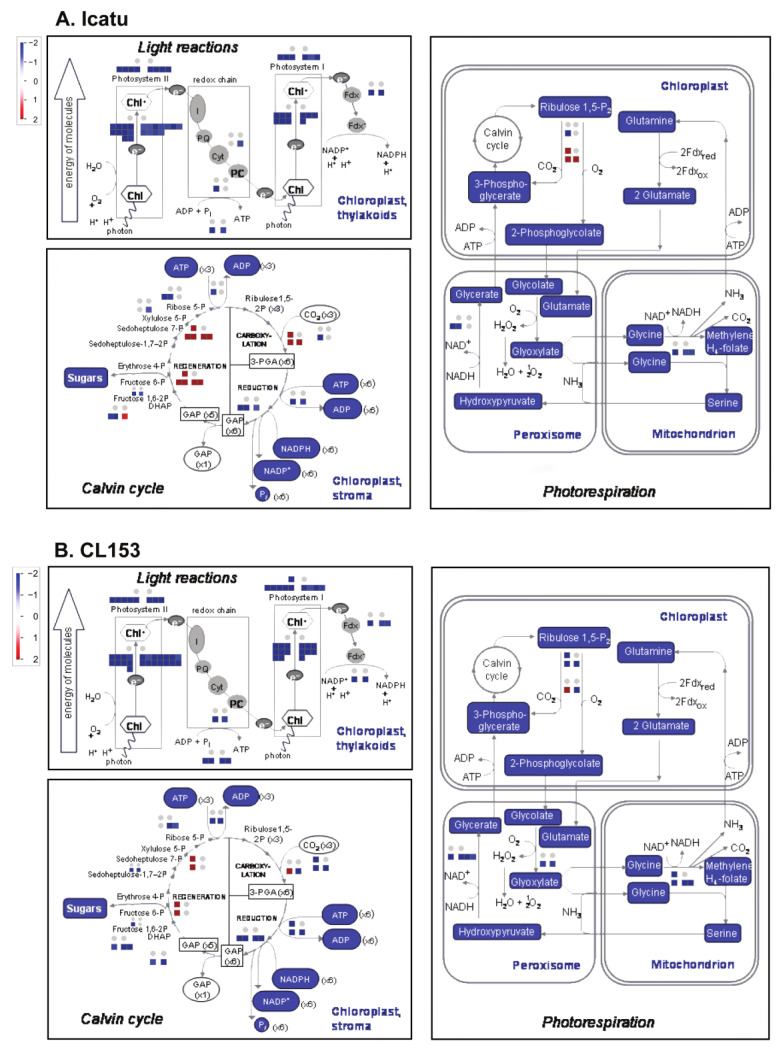
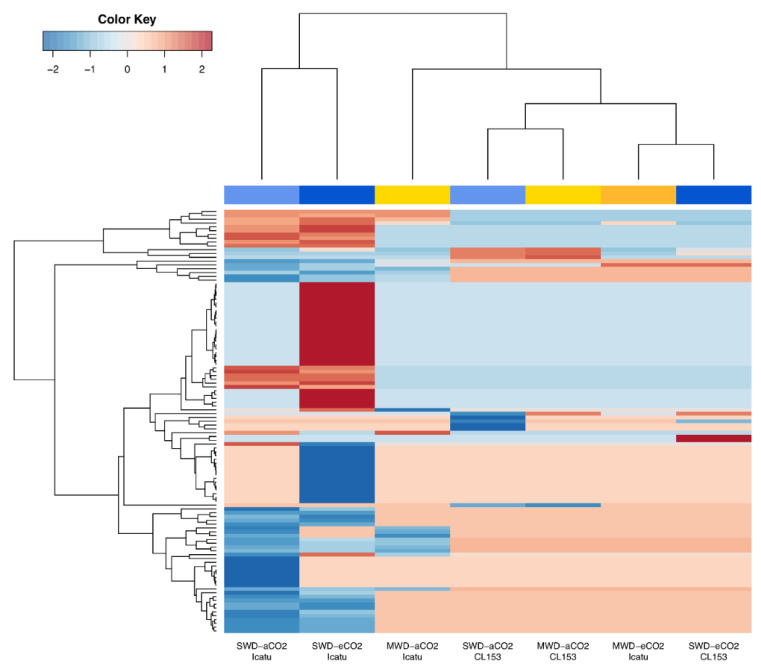
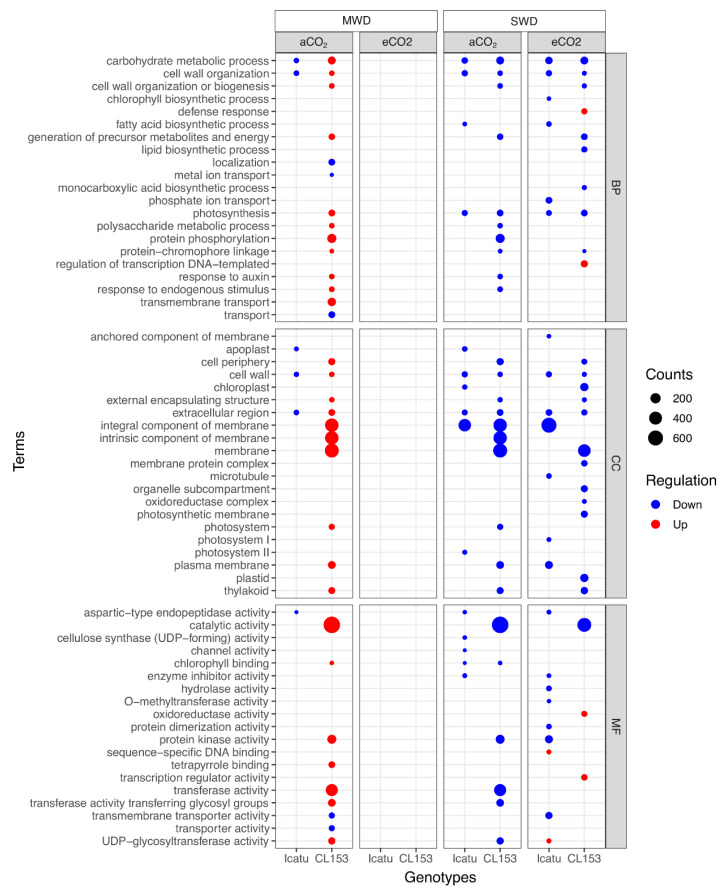
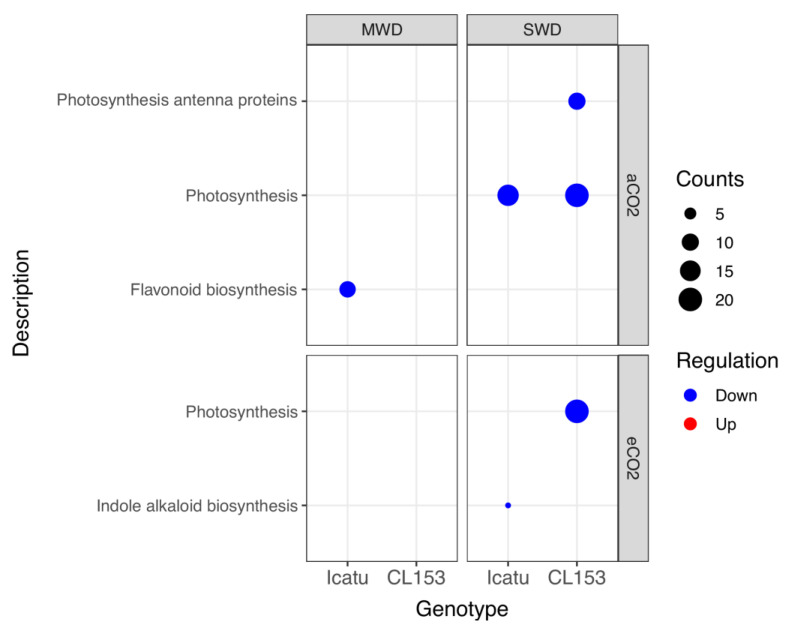
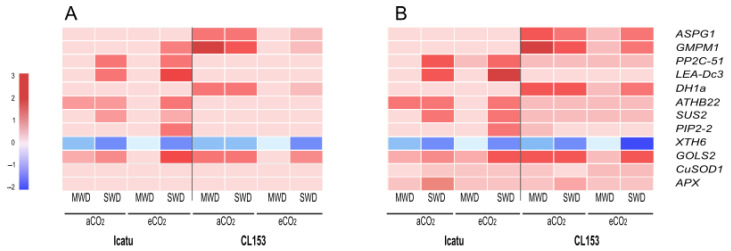
Drought is a major constraint to plant growth and productivity worldwide and will aggravate as water availability becomes scarcer. Although elevated air [CO2] might mitigate some of these effects in plants, the mechanisms underlying the involved responses are poorly understood in woody economically important crops such as Coffea. This study analyzed transcriptome changes in Coffea canephora cv. CL153 and C. arabica cv. Icatu exposed to moderate (MWD) or severe water deficits (SWD) and grown under ambient (aCO2) or elevated (eCO2) air [CO2]. We found that changes in expression levels and regulatory pathways were barely affected by MWD, while the SWD condition led to a down-regulation of most differentially expressed genes (DEGs). eCO2 attenuated the impacts of drought in the transcripts of both genotypes but mostly in Icatu, in agreement with physiological and metabolic studies. A predominance of protective and reactive oxygen species (ROS)-scavenging-related genes, directly or indirectly associated with ABA signaling pathways, was found in Coffea responses, including genes involved in water deprivation and desiccation, such as protein phosphatases in Icatu, and aspartic proteases and dehydrins in CL153, whose expression was validated by qRT-PCR. The existence of a complex post-transcriptional regulatory mechanism appears to occur in Coffea explaining some apparent discrepancies between transcriptomic, proteomic, and physiological data in these genotypes.

Keywords: ABA signaling; ROS; coffee; functional analysis; stress; tolerance.


Conflict of interest statement

The authors declare no conflict of interest.

Figures

Figure 1
Figure 1
Total number of expressed genes in Icatu and CL153 plants grown under different watering conditions (well-watered, WW; moderate water deficit, MWD; and severe water deficit, SWD), and under ambient air 380 μL L−1 [CO2] (aCO2) or elevated 700 μL L−1 [CO2] (eCO2), at 25/20 °C.
Figure 2
Figure 2
Patterns of differentially expressed genes (DEGs) at MWD or SWD in comparison with WW in (A) Icatu and (B) CL153 plants grown under either aCO2 (light colors) or eCO2 (dark colors), at 25/20 °C (day/night). Blue: DEGs specifically found under MWD. Yellow: DEGs specifically found under SWD. Green: DEGs expressed by both water conditions. Gene ontology (GO) terms found among the top up- and down-regulated differentially expressed genes (DEGs) in (C) Icatu and (D) CL153 plants. GO terms were selected according to UniProtKB and QuickGO databases.
Figure 3
Figure 3
Proportion and number of significantly up- (red) and down-regulated (blue) DEGs associated with physiological and biochemical responses found in (A) Icatu and (B) CL153 plants grown under MWD or SWD in comparison with WW plants grown under aCO2 or eCO2, at 25/20 °C (day/night).
Figure 4
Figure 4
Changes in the expression of photosynthesis-related DEGs in (A) Icatu and (B) CL153 plants grown under MWD or SWD in comparison with WW plants grown under aCO2 or eCO2, at 25/20 °C (day/night). Pathway diagrams of light reactions of photosynthesis, the Calvin cycle, and photorespiration with superimposed color-coded squares drawn in MapMan. The color scale represents the level of regulation (blue: down-regulated DEGs; red: up-regulated DEGs). Results in the squares are presented in the following order: top left—MWD-aCO2; top right—MWD-eCO2; bottom left—SWD-aCO2; bottom right—SWD-eCO2. Grey dots represent an absence of DEGs. An absence of data in eCO2 indicates the absence of DEGs.
Figure 5
Figure 5
Clustered heatmaps and dendrograms of the normalized log2 fold change (FC) visualizing the expression of drought-related DEGs in Icatu and CL153 plants grown under MWD or SWD in comparison with WW plants grown under aCO2 or eCO2, at 25/20 °C (day/night). Values were scaled by row using Z-scores. Hot colors represent up-regulated DEGs, and cold colors represent down-regulated DEGs. Column color labels groups comparisons by water treatments (yellow/orange: MWD; light blue/dark blue: SWD; light colors represent aCO2; dark colors represent eCO2). An absence of data in CL153 plants under MWD-eCO2 indicates the absence of significant DEGs.
Figure 6
Figure 6
Over-representation analysis of gene ontology (GO) terms found among Icatu and CL153 DEGs performed with gProfiler against the functional annotation of Coffea arabica and Coffea canephora genomes, respectively. Significantly (g:SCS < 0.01) enriched GO was ranked by decreasing log2 fold-change (FC), considering the effect of MWD or SWD in comparison with WW plants grown under aCO2 or eCO2, at 25/20 °C (day/night). Dot plots with all GO terms were filtered by REVIGO with similarity = 0.5, and a count > 10 cut-offs. Terms are grouped by the main category: Biological Process (BP), Molecular Function (MF), and Cellular Component (CC). Counts (size) indicate the number of DEGs annotated with each GO term and color represents the type of regulation (blue: down-regulated DEGs; red: up-regulated DEGs). An absence of data in eCO2 under MWD indicates the absence of enriched GO terms.
Figure 7
Figure 7
Over-representation analysis of KEGG pathways of Icatu and CL153 down-regulated DEGs performed with gProfiler, using the DEGs’ Arabidopsis thaliana homologs mapped through blastx, against the functional annotation of its reference genome. Significantly (g:SCS < 0.01) enriched KEGG pathways of DEGs ranked by decreasing log2 fold-change (FC), considering the effect of MWD or SWD in comparison with WW plants grown under aCO2 or eCO2, at 25/20 °C (day/night). Counts (size) indicate the number of DEGs annotated with each GO term. An absence of data in CL153 indicates the absence of significant KEGG pathways.
Figure 8
Figure 8
Heatmap of expression levels (log2 ratio) of the selected genes obtained from RNA-seq (A) and validated by qRT-PCR (B), considering the effect of MWD or SWD in comparison with WW-Icatu and CL153 plants, grown under aCO2 (light colors) or eCO2 (dark colors), at 25/20 °C (day/night). GMPM1: 18 kDa seed maturation; PP2C-51: protein phosphatase 2C 51-like; LEA-DC3: late embryogenesis abundant protein Dc3-like; DH1a: dehydrin DH1a; ATHB22: homeobox leucine zipper; SUS2: sucrose synthase 2-like; PIP2-2: aquaporin PIP2-2-like; XTH6: xyloglucan endotransglucosylase/hydrolase protein 6; GOLS2: galactinol synthase 2-like; CuSOD1: superoxide dismutase [Cu-Zn]; APXChl: chloroplast ascorbate peroxidase.

References

    1. Solomon S., Plattner G.K., Knutti R., Friedlingstein P. Irreversible climate change due to carbon dioxide emissions. Proc. Natl. Acad. Sci. USA. 2009;106:1704–1709. doi: 10.1073/pnas.0812721106. - DOI - PMC - PubMed
    1. Raza A., Mubarik M.S., Sharif R., Habib M., Jabeen W., Zhang C., Chen H., Chen Z.-H., Siddique K.H.M., Zhuang W., et al. The Plant Genome Developing drought-smart, ready-to-grow future crops. Plant Genome. 2022:e20279. doi: 10.1002/tpg2.20279. - DOI - PubMed
    1. Brodribb T.J., McAdam S.A.M. Evolution of the Stomatal Regulation of Plant Water Content. Plant Physiol. 2017;174:639–649. doi: 10.1104/pp.17.00078. - DOI - PMC - PubMed
    1. Chaves M.M., Maroco J.P., Pereira J.S. Understanding plant responses to drought-From genes to the whole plant. Funct. Plant Biol. 2003;30:239–264. doi: 10.1071/FP02076. - DOI - PubMed
    1. Muller B., Pantin F., Génard M., Turc O., Freixes S., Piques M., Gibon Y. Water deficits uncouple growth from photosynthesis, increase C content, and modify the relationships between C and growth in sink organs. J. Exp. Bot. 2011;62:1715–1729. doi: 10.1093/jxb/erq438. - DOI - PubMed

LinkOut - more resources