. 2023 Feb 7;24(4):3260.
doi: 10.3390/ijms24043260.

Acute PDE4 Inhibition Induces a Transient Increase in Blood Glucose in Mice

Affiliations

Acute PDE4 Inhibition Induces a Transient Increase in Blood Glucose in Mice

Daniel Irelan et al. Int J Mol Sci. .

Abstract

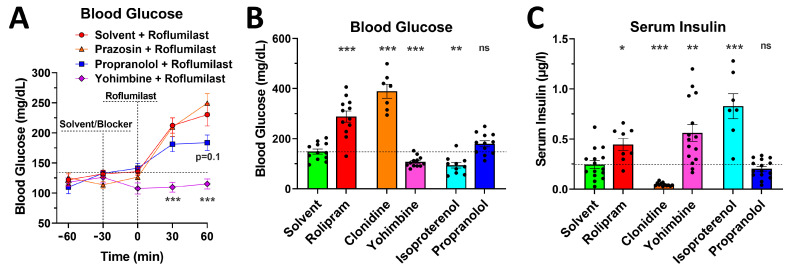
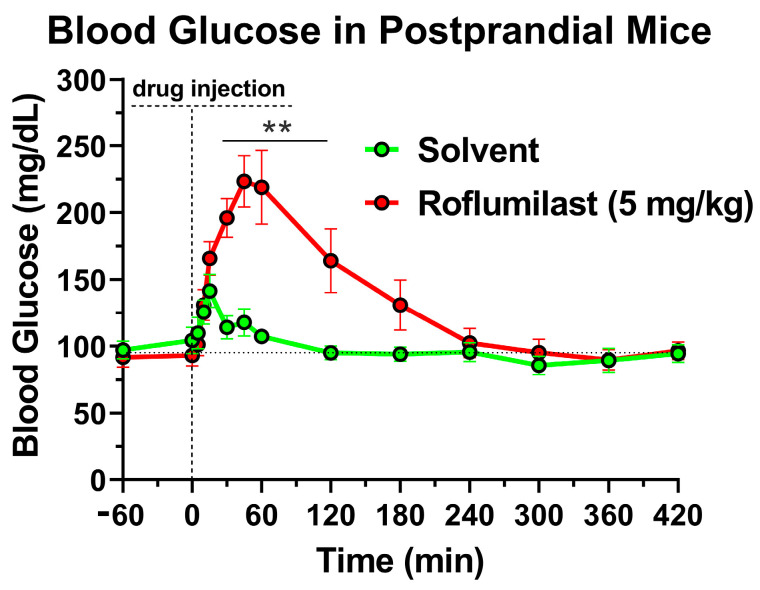
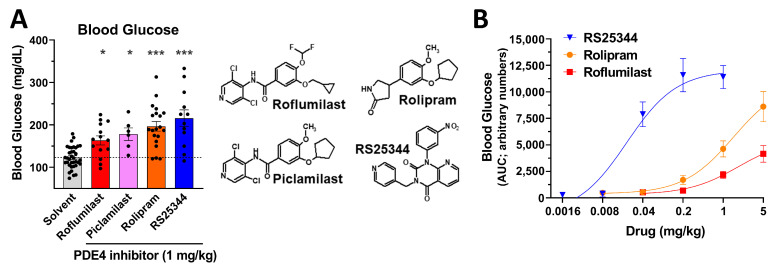
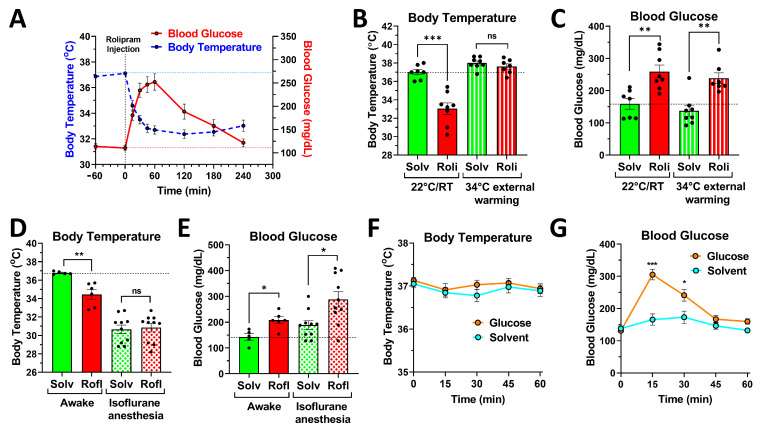
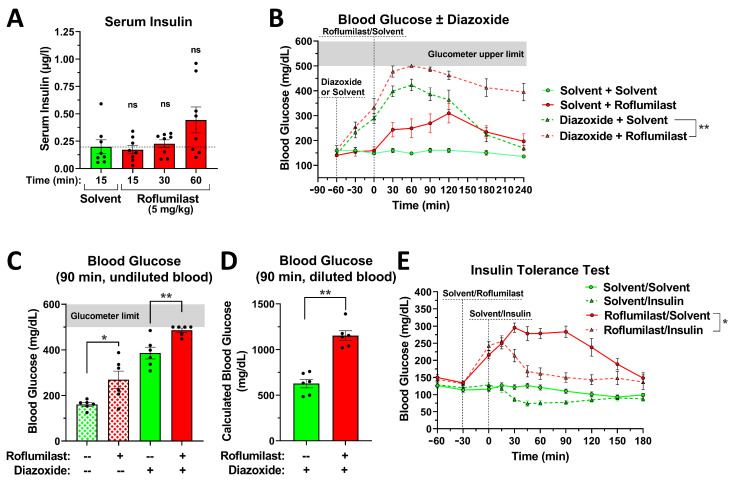
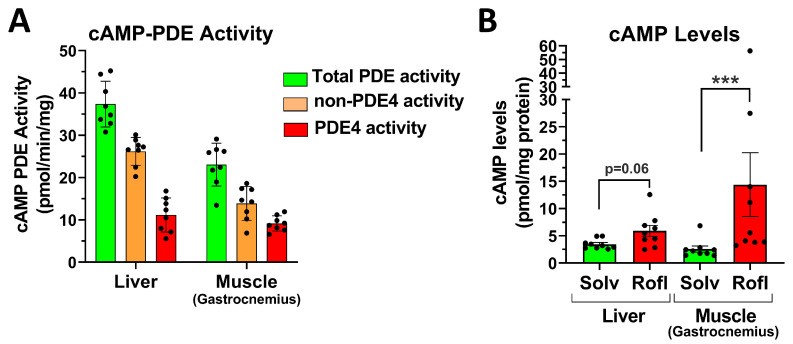
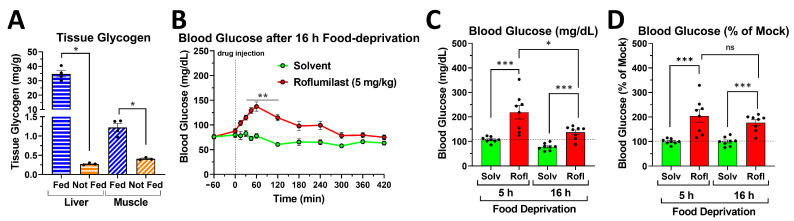
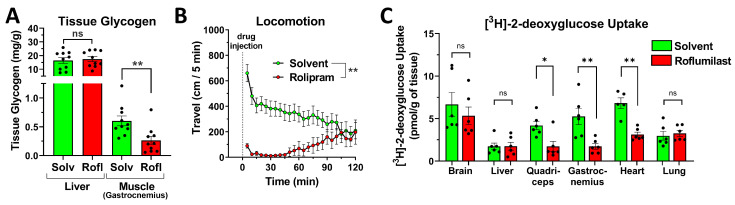
cAMP-phosphodiesterase 4 (PDE4) inhibitors are currently approved for the treatment of inflammatory diseases. There is interest in expanding the therapeutic application of PDE4 inhibitors to metabolic disorders, as their chronic application induces weight loss in patients and animals and improves glucose handling in mouse models of obesity and diabetes. Unexpectedly, we have found that acute PDE4 inhibitor treatment induces a temporary increase, rather than a decrease, in blood glucose levels in mice. Blood glucose levels in postprandial mice increase rapidly upon drug injection, reaching a maximum after ~45 min, and returning to baseline within ~4 h. This transient blood glucose spike is replicated by several structurally distinct PDE4 inhibitors, suggesting that it is a class effect of PDE4 inhibitors. PDE4 inhibitor treatment does not reduce serum insulin levels, and the subsequent injection of insulin potently reduces PDE4 inhibitor-induced blood glucose levels, suggesting that the glycemic effects of PDE4 inhibition are independent of changes in insulin secretion and/or sensitivity. Conversely, PDE4 inhibitors induce a rapid reduction in skeletal muscle glycogen levels and potently inhibit the uptake of 2-deoxyglucose into muscle tissues. This suggests that reduced glucose uptake into muscle tissue is a significant contributor to the transient glycemic effects of PDE4 inhibitors in mice.

Keywords: 2-deoxyglucose; PDE4; adrenergic signaling; blood glucose; cAMP-phosphodiesterase; insulin; skeletal muscle.


Conflict of interest statement

The authors declare no conflict of interest. The funders had no role in the design of the study; in the collection, analyses, or interpretation of data; in the writing of the manuscript; or in the decision to publish the results.

Figures

Figure 5
Figure 5
Pretreatment with the β-blocker propranolol or the α2-adrenoceptor blocker yohimbine alleviates the glycemic effects of PAN-PDE4 inhibition. (A) Postprandial mice were injected (i.p.) with the β-blocker propranolol (5 mg/kg), the α1-adrenoceptor blocker prazosin (1 mg/kg), the α2-adrenoceptor blocker yohimbine (5 mg/kg), or solvent controls, followed 30 min later with an injection of the PDE4 inhibitor roflumilast (5 mg/kg), in all mice. Blood glucose levels measured at tail pricks are shown at the indicated time points. (B,C) Postprandial mice were injected with the PDE4 inhibitor rolipram (5 mg/kg), the α2-adrenoceptor agonist clonidine (1 mg/kg), the α2-adrenoceptor blocker yohimbine (5 mg/kg), the β-agonist isoproterenol (5 mg/kg), the β-blocker propranolol (5 mg/kg), or solvent controls, followed 60 min later by the measurement of blood glucose levels at tail pricks (B) and subsequent cheek bleeds to assess serum insulin levels via an ELISA (C). All data represent the mean ± SEM. Statistical significance was determined using the Mann–Whitney test (bar graphs) or a two-way ANOVA with Sidak’s post hoc test (time courses), and is indicated as ns (p > 0.05); * (p < 0.05); ** (p < 0.01); and *** (p < 0.001).
Figure 1
Figure 1
Acute treatment with the PAN-PDE4 inhibitor roflumilast induces a transient increase in postprandial blood glucose levels. The graph shows blood glucose levels, measured with glucometer test strips at tail pricks in postprandial mice that had been deprived of food for 5 h prior to treatment with the PAN-PDE4 inhibitor roflumilast (5 mg/kg; intraperitoneal (i.p.) injection) or solvent controls. The data represent the mean ± SEM of n = 8 mice. Roflumilast significantly increased blood glucose levels (**, p < 0.01) compared to solvent controls, as determined by a two-way ANOVA with Sidak’s post hoc test.
Figure 2
Figure 2
An acute increase in blood glucose levels is a class effect of PAN-PDE4 inhibitors. (A) Blood glucose levels in postprandial mice are shown at 30 min after the injection (i.p.) of the PAN-PDE4 inhibitors roflumilast, piclamilast/RP73401, rolipram, and RS25344 (all 1 mg/kg), or solvent controls. The chemical structures of the PDE4 inhibitors are shown for comparison. Data represent the mean ± SEM. Statistical significance was determined using Kruskal–Wallis and Dunn’s post hoc tests and is indicated as * (p < 0.05) and *** (p < 0.001). (B) After measuring baseline blood glucose levels (0 min time point) in postprandial mice, the animals were injected with the indicated doses of RS25344, rolipram, or roflumilast (all i.p.; n ≥ 6) and blood glucose levels were measured again at 30, 60, 90, and 120 min after drug injection. Data represent the mean ± SEM and are expressed as the area under the curve (AUC). Dose-response curves for RS25344, rolipram, and roflumilast are significantly different (p < 0.01) from each other, as determined by a two-way ANOVA with Sidak’s post hoc test.
Figure 3
Figure 3
Transient hypothermia and hyperglycemia are independent effects of PAN-PDE4 inhibitor treatment. (A) Treatment with a PAN-PDE4 inhibitor induces acute hypothermia, as well as hyperglycemia, on similar time courses. Postprandial mice were injected with the PDE4 inhibitor rolipram (5 mg/kg; i.p.; n = 12) and blood glucose levels (red/solid line) and body temperature (blue/striated line) were measured at the indicated time points. (B,C) External warming prevents PDE4 inhibitor-induced hypothermia, but not increased blood glucose levels. After 5 h of food deprivation, mice were acclimated to cages maintained at room temperature (22 °C; solid bars) or to cages externally warmed to 34 °C using an electric heater (striated bars). Mice were then injected with rolipram (Roli; 5 mg/kg; i.p.) or the solvent control (Solv), and body temperature (B) and blood glucose levels (C) were assessed 30 min later. (D,E) Isoflurane anesthesia equalizes body temperatures and locomotion but does not prevent increased blood glucose levels in response to PDE4 inhibitor treatment. Shown are the body temperatures (D) and blood glucose levels (E) in mice at 30 min after treatment with the PAN-PDE4 inhibitor roflumilast (Rofl; 5 mg/kg; i.p.) or solvent controls (Solv). The effects of drug treatment were compared in awake mice (solid bars) to mice maintained under continuous isoflurane anesthesia beginning at 10 min prior to drug/solvent injection and continued throughout (patterned bars). (F,G) Elevated blood glucose levels do not cause hypothermia in mice. After an assessment of baseline body temperature and blood glucose levels, postprandial mice were given glucose (2 g/kg in water; oral gavage (o.g.); n = 10) or the same volume of water (solvent), and body temperature (F) and blood glucose levels (G) were measured at the indicated time points. All data represent the mean ± SEM. Statistical significance was determined using Mann–Whitney tests (bar graphs) or a two-way ANOVA with Sidak’s post hoc test (time courses) and is indicated as: ns (p > 0.05); * (p < 0.05); ** (p < 0.01); and *** (p < 0.001).
Figure 4
Figure 4
The acute glycemic effects of PDE4 inhibition are not driven by changes in insulin secretion or tissue insulin sensitivity. (A) PDE4 inhibition does not lower serum insulin levels. Shown are insulin levels measured in serum of postprandial mice that had been cheek-bled at the indicated times after injection of the PDE4 inhibitor roflumilast (5 mg/kg; i.p.) or solvent control. (BD) Inhibition of insulin release with diazoxide elevates blood glucose levels via a mechanism that is distinct and additive to that of PDE4 inhibition. After 5 h of food deprivation, mice were injected with diazoxide (25 mg/kg; i.p.; n = 6; −60 min time point) or solvent control, followed 60 min later by a second injection with either the PAN-PDE4 inhibitor roflumilast (5 mg/kg; i.p.; 0 min time point) or solvent control. The glucometer used to measure blood glucose at tail pricks does not read above the upper limit of 500 mg/dL glucose that is indicated by the grey-shaded area. Treatment with roflumilast significantly (p < 0.01) increased blood glucose levels compared to solvent controls, in both the absence and presence of diazoxide. In (C,D), blood glucose levels measured at 90 min after PDE4 inhibitor treatment in the same mice are reported. (C) shows the blood glucose levels measured in undiluted blood directly at the mouse tail-vein prick, leading to 4 out of 6 mice in the “diazoxide/roflumilast” group reading at the detection limit of 500 mg/dL. In (D), shown are calculated blood glucose levels for the diazoxide-treated groups that were measured after diluting 1 µL of tail-vein blood 1:5 with PBS, thus obtaining readings in the normal range of the glucometer. (E) PDE4 inhibition does not impair insulin sensitivity. After 5 h of food deprivation, mice were injected with the PDE4 inhibitor roflumilast (5 mg/kg; i.p.; n ≥ 10; −30 min time point) or solvent control, followed 30 min later with an injection of insulin (Humulin R; i.p.; 0 min time point) or solvent control. Shown are blood glucose measurements at tail-vein pricks at the indicated time points. The injection of insulin induced a significant reduction (p < 0.001) in blood glucose levels, in both the absence and the presence of roflumilast. All data represent the mean ± SEM. Statistical significance was determined using the Mann–Whitney test (bar graphs comparing two groups) and the Kruskal–Wallis test, followed by Dunn’s post hoc test to determine the differences between more than two treatment groups or by a two-way ANOVA with Sidak’s post hoc test (time courses), and is indicated as ns (p > 0.05); * (p < 0.05); and ** (p < 0.01).
Figure 6
Figure 6
PDE4 activity and cAMP levels in metabolic tissues. (A) Detergent extracts, prepared from mouse liver and skeletal muscle (gastrocnemius), were subjected to in vitro cAMP-PDE activity assays in the presence or absence of the PDE4 inhibitor rolipram (10 µM). Total cAMP-PDE activity is defined as the rate of cAMP hydrolysis measured in the absence of rolipram, whereas PDE4 and non-PDE4 activity are defined as the fraction of total activity that is either inhibited or that is insensitive to inhibition by rolipram, respectively. (B) Shown are cAMP levels in the tissues of postprandial mice at 30 min after treatment with the PAN-PDE4 inhibitor roflumilast (5 mg/kg; i.p.) or solvent control (Solv). Data represent the mean ± SEM. Statistical significance was determined using the Mann-Whitney test and is indicated as *** (p < 0.001).
Figure 7
Figure 7
Glucose release from hepatic glycogen is not required for the glycemic effects of PAN-PDE4 inhibitors. (A) The glycogen levels in the liver and skeletal muscle (gastrocnemius) of fed mice (which were given 4 g/kg glucose o.g. at 60 min prior to euthanasia and tissue extraction) and of mice deprived of food for 16 h overnight (Not Fed) are shown. (BD) Mice were food-deprived for 16 h overnight prior to treatment with either the PAN-PDE4 inhibitor roflumilast (Rofl; 5 mg/kg; i.p.; n = 8) or solvent control. (B) Shown is the complete time course of blood glucose levels in mice deprived of food for 16 h overnight after treatment with roflumilast or solvent control. (C,D) Comparison of blood glucose levels at 60 min after treatment with roflumilast or solvent control (Solv) in mice food-deprived for 5 h (data extracted from Figure 1) or in mice food-deprived for 16 h overnight (data extracted from Figure 7B). Data are reported as either the amount of blood glucose in mg/dL(C) or as a percentage of the solvent control (D). All data represent the mean ± SEM. Statistical significance was determined using the Mann–Whitney test (bar graphs) or a two-way ANOVA with Sidak’s post hoc test (time courses) and is indicated as ns (p > 0.05); * (p < 0.05); ** (p < 0.01); and *** (p < 0.001).
Figure 8
Figure 8
PDE4 inhibition induces glycogenolysis in skeletal muscle and inhibits glucose uptake in skeletal muscle and heart. (A) PDE4 inhibition induces glycogenolysis in skeletal muscle. The glycogen levels in the liver and skeletal muscle (gastrocnemius) in postprandial mice are shown after treatment with the PAN-PDE4 inhibitor roflumilast (Rofl; 5 mg/kg; i.p.) or solvent control (Solv) for 90 min. Data are expressed as mg of glycogen per g of tissue weight. (B) PAN-PDE4 inhibition reduces locomotion, as reflected by reduced travel distance. Mice were injected with the PDE4 inhibitor rolipram (3 mg/kg; i.p.; n = 6) or solvent control, placed immediately in a new cage, and then locomotion was assessed using SmartCageTM technology. Traces represent changes in travel distance (cm per 5 min interval). (C) Postprandial mice were injected with the PDE4 inhibitor roflumilast (5 mg/kg; i.p.) or solvent control, followed 15 min later by injection with [3H]-2-deoxyglucose (intravenous, i.v.). Animals were euthanized 30 min after the tracer injection, their tissues were homogenized, and the phosphorylated [3H]-2-deoxyglucose-6-phosphate was isolated by anion exchange chromatography and quantified by scintillation counting. Data are expressed as pmol [3H]-2-deoxyglucose-6-phosphate per g of tissue wet weight. All data represent the mean ± SEM. Statistical significance was determined using the Mann–Whitney test (bar graphs) or a two-way ANOVA with Sidak’s post hoc test (time courses) and is indicated as ns (p > 0.05), * (p < 0.05), and ** (p < 0.01).

Similar articles

Cited by

References

    1. Rogne M., Taskén K. Compartmentalization of cAMP signaling in adipogenesis, lipogenesis, and lipolysis. Horm. Metab. Res. 2014;46:833–840. doi: 10.1055/s-0034-1389955. - DOI - PubMed
    1. Yang H., Yang L. Targeting cAMP/PKA pathway for glycemic control and type 2 diabetes therapy. J. Mol. Endocrinol. 2016;57:R93–R108. doi: 10.1530/JME-15-0316. - DOI - PubMed
    1. Bouchez C., Devin A. Mitochondrial Biogenesis and Mitochondrial Reactive Oxygen Species (ROS): A Complex Relationship Regulated by the cAMP/PKA Signaling Pathway. Cells. 2019;8:287. doi: 10.3390/cells8040287. - DOI - PMC - PubMed
    1. Gerich J.E. Control of glycaemia. Baillières Clin. Endocrinol. Metab. 1993;7:551–596. doi: 10.1016/S0950-351X(05)80207-1. - DOI - PubMed
    1. Hers H. Mechanisms of blood glucose homeostasis. J. Inherit. Metab. Dis. 1990;13:395–410. doi: 10.1007/BF01799497. - DOI - PubMed