. 2023 Feb 7;24(4):3279.
doi: 10.3390/ijms24043279.

Blue-to-Red TagFT, mTagFT, mTsFT, and Green-to-FarRed mNeptusFT2 Proteins, Genetically Encoded True and Tandem Fluorescent Timers

Affiliations

Blue-to-Red TagFT, mTagFT, mTsFT, and Green-to-FarRed mNeptusFT2 Proteins, Genetically Encoded True and Tandem Fluorescent Timers

Oksana M Subach et al. Int J Mol Sci. .

Abstract

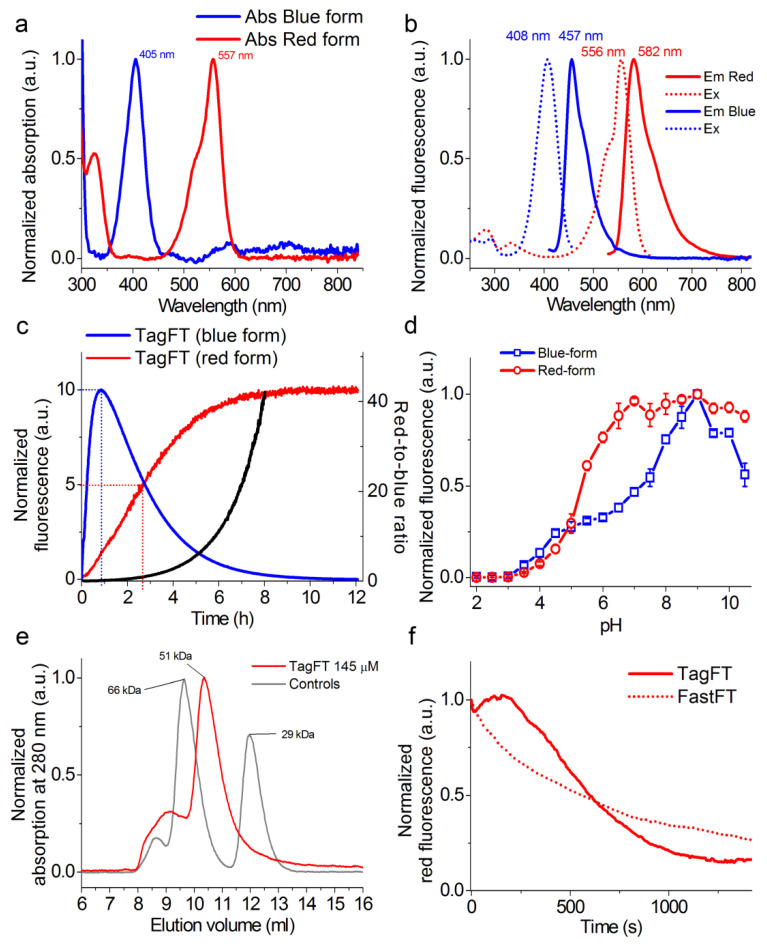
True genetically encoded monomeric fluorescent timers (tFTs) change their fluorescent color as a result of the complete transition of the blue form into the red form over time. Tandem FTs (tdFTs) change their color as a consequence of the fast and slow independent maturation of two forms with different colors. However, tFTs are limited to derivatives of the mCherry and mRuby red fluorescent proteins and have low brightness and photostability. The number of tdFTs is also limited, and there are no blue-to-red or green-to-far-red tdFTs. tFTs and tdFTs have not previously been directly compared. Here, we engineered novel blue-to-red tFTs, called TagFT and mTagFT, which were derived from the TagRFP protein. The main spectral and timing characteristics of the TagFT and mTagFT timers were determined in vitro. The brightnesses and photoconversions of the TagFT and mTagFT tFTs were characterized in live mammalian cells. The engineered split version of the TagFT timer matured in mammalian cells at 37 °C and allowed the detection of interactions between two proteins. The TagFT timer under the control of the minimal arc promoter, successfully visualized immediate-early gene induction in neuronal cultures. We also developed and optimized green-to-far-red and blue-to-red tdFTs, named mNeptusFT and mTsFT, which were based on mNeptune-sfGFP and mTagBFP2-mScarlet fusion proteins, respectively. We developed the FucciFT2 system based on the TagFT-hCdt1-100/mNeptusFT2-hGeminin combination, which could visualize the transitions between the G1 and S/G2/M phases of the cell cycle with better resolution than the conventional Fucci system because of the fluorescent color changes of the timers over time in different phases of the cell cycle. Finally, we determined the X-ray crystal structure of the mTagFT timer and analyzed it using directed mutagenesis.

Keywords: FucciFT2; TagFT; crystal structure; fluorescence imaging; fluorescent protein; genetically encoded blue-to-red fluorescent timers; mNeptusFT2; mTagFT; mTsFT; protein engineering.


Conflict of interest statement

The authors declare no conflict of interest. The funders had no role in the design of the study; in the collection, analysis, or interpretation of data; in the writing of the manuscript; or in the decision to publish the results.

Figures

Figure 1
Figure 1
Amino acid sequence alignment of the timers TagFT, mTagFT, and mRubyFT and the fluorescent proteins GFP and TagRFP. Alignment numbering follows that of Aequorea victoria GFP. The residues inside the β-barrel are in gray. Asterisks (***) indicate the chromophore-forming tripeptide. Internal and external mutations in the TagFT, mTagFT, and mRubyFT timers, relative to the TagRFP and mRuby2 progenitors, are highlighted in red and cyan, respectively.
Figure 2
Figure 2
In vitro properties of the purified TagFT protein. (a) Absorption spectra of the blue and red forms of the TagFT protein in PBS buffer at pH 7.40. (b) Excitation and emission spectra of the blue and red forms of TagFT in PBS buffer at pH 7.40. (c) Maturation of blue and red forms of TagFT in PBS buffer at pH 7.40 and 37 °C. The red-to-blue ratio (black curve) was calculated according to the red and blue fluorescence time dependences normalized to 100. (d) Fluorescence intensity of the blue and red forms of TagFT as a function of pH. Three replicates were averaged for analysis. Error bars represent the standard deviation. (e) Fast protein liquid chromatography of the TagFT protein. TagFT eluted in 20 mM Tris-HCl (pH 7.80) and 200 mM NaCl buffer. The molecular weight of TagFT was calculated from a linear regression of the dependence of logarithm of control molecular weights vs. elution volume. (f) Photostability of red forms of TagFT and control FastFT timers under continuous wide-field imaging using a mercury lamp (9 mW/cm2 550/25 nm light power before objective lens).
Figure 3
Figure 3
Comparison of the brightnesses and blue-to-red photoconversions of the TagFT, mTagFT, mTsFT, and control mRubyFT timers in live mammalian cells. (a) Confocal images of live HeLa cells expressing the TagFT-P2A-EGFP fusion. P2A is a self-cleavable peptide. Blue (405 ex and 447/60 em) and red (561 ex and 617/73 em) fluorescence channels are shown for expression lasting for 72 h. (b,c) The averaged brightness of the blue (b, 24 h after transfection) and red forms (c, 72 h after transfection) of the TagFT, mTagFT, mTsFT, and control mRubyFT timers in HeLa cells normalized to the brightness of the EGFP expressed in the same cell. Error bars are standard deviations across 5–24 cells. (d) The mean ΔF/F values for the photobleached blue forms and photoconverted red forms of TagFT, mTagFT, mTsFT, and control mRubyFT timers expressed in live HEK293T cells 24 h after transfection. The pulse of 395/25 nm light (0.338 mW/cm2 power measured before the 60× oil objective lens) lasted for 1 min. Error bars are standard deviations across 8–11 cells. (e) The efficiency of the blue-to-red photoconversion with 395/25 nm light for 1 min was calculated as ΔF/Fred/ΔF/Fblue. (f) Confocal images of live HEK293T cells expressing mRubyFT-P2A-EGFP or the TagFT-P2A-EGFP fusion. Blue (405 ex and 447/60 em) and red (561 ex and 617/73 em) fluorescence channels before and after continuous irradiation with 395/25 nm light for 1 min are shown. Protein expression lasted 24 h. The contrast settings were the same for red and blue images. Images were acquired 72 h (a) or 24 h (f) after transfection. (be) The p values show significant differences between the respective values. ****, p value is <0.0001. **, p value is <0.01. ***, p value is <0.001. *, p value is <0.05. (a,f) Scale bars: 50 µm.
Figure 4
Figure 4
Confocal imaging of the mTagFT timer in fusions with cytoskeleton proteins in live mammalian cells. Confocal images of HeLa Kyoto cells in blue (405 ex and 447/60 em) and red (561ex and 617/73em) channels and red-to-blue ratio 24 or 72 h after transfection with (a) pmTagFT-β-actin, (b) pmTagFT-α-tubulin, (c) pVimentin-mTagFT, or (d) pVimentin-TagFT plasmids. Scale bar: 10 µm. For blue-to-red ratio image calculation, the background was subtracted, and a ratio image was generated using ImageJ software; the background ratio was manually cut around the cells.
Figure 5
Figure 5
Characterization of the split TagFT version in mammalian cells. (a) Scheme of split mTagFT in fusion with bJun (in blue) and bFos (in green) heterodimerizing proteins, in which heterodimerization facilitates TagFT trimer assembly with formation of the blue form followed by conversion to the red form over time. (b) Confocal images of HeLa Kyoto cells in blue (405ex and 447/60em) and red (561ex and 617/73em) channels and channel overlay 24 h after cotransfection with pAAV-CAG-bJun-TagFTN and pAAV-CAG-bFos-TagFTN plasmids. Scale bar: 19 µm. (c) Comparison of the brightnesses of bJun-TagFTN/bFos-TagFTC and bJun-mRubyFTN/bFos-mRubyFTC constructs expressed in live HeLa cells. (d) Comparison of the brightnesses of bJun-TagFTN/bFos-TagFTC and bJun-TagFTN/bFosΔZip-TagFTC constructs expressed in live HeLa cells. (c,d) Brightnesses of the blue and red forms normalized to the brightness of EGFP coexpressed in the same cells. ****, p value is <0.0001. **, p value is <0.01. *, p value is <0.05.
Figure 6
Figure 6
Chemical induction of the expression of the blue-to-red timer TagFT-3xNLS and the green protein EGFP from the promoters of the early genes arc1 and c-fos, respectively, in hippocampal culture. (a) Confocal images of cells in the superimposed blue–green–red fluorescence channel are shown at the indicated times after chemical stimulation of neuronal culture with 100 mM KCl (3 times 2 min each, 5 min apart). (b) Image of neuronal culture in visible light. (c) Dynamics of blue, green, and red fluorescence changes in the neuronal cell nucleus indicated by the arrow in panels a and b. The hippocampal culture was isolated from Barth line mice, which have a GFP under the control of the promoter of the early c-fos gene. On the fourth day after plating, the hippocampal culture was infected with recombinant adeno-associated viral particles carrying the arc1 promoter and TagFT timer gene Arc1-TagFT-3xNLS. Scale bar: 30 µm.
Figure 7
Figure 7
Brightness characterization of the timers in fusions with cycle-dependently degradable hCdt1-100 and hGeminin proteins in mammalian cells and visualization of the cell cycle using the FucciFT2 system, which includes blue-to-red TagFT-hCdt1-100 and green-to-far-red mNeptusFT2-hGeminin fusions. (ad) Confocal images of HeLa cells stably expressing MediumFT-hCdt1–100 (a), mTsFT-hCdt1–100 (b), mTsFT-hGeminin (c), or mNeptusFT2-hCdt1-–00 (d). (ad) Scale bar: 19 µm. The fluorescence intensities were quantified from images acquired using the same microscope settings. (e) Scheme describing the function of the FucciFT system, which colors the G1 and S/G2/M phases in blue/red and green/far-red (in yellow), respectively. (f) Confocal images of HeLa cells stably expressing the FucciFT2 system are shown in blue/green/red/far-red overlaid channels for blue-to-red TagFT-hCdt1–100 (in blue and red overlaid pseudocolors, respectively) and green-to-far-red mNeptusFT2-hGeminin fusions (in green and yellow overlaid pseudocolor, respectively). Scale bar: 30 µm. **, p value is <0.01. *, p value is <0.05. ns, p value is > 0.05.
Figure 8
Figure 8
X-ray structure of the red form of the mTagFT protein. (a) Cartoon representation of the overall red mTagFT monomer. Chromophore, β-sheets, α-helixes, and loop regions are shown in pink, yellow, red, and green, respectively. The orientation of the panel on the right is rotated 90° around the horizontal axis with respect to that on the left. (b) The immediate environment of the red mTagFT chromophore. The imidazole ring of the chromophore is shown in magenta. Hydrogen bonds are depicted as dashed lines, and corresponding distances are labeled. Green and yellow tyrosine rings correspond to trans- and cis-configurations of TagRFP (PDB ID–3M22) and mRubyFT (PDB ID–7QGK), respectively. (c) The Polder electron density map (Fo-Fc) around the chromophore of the red mTagFT protein. The map is contoured at the 1.0 σ level and shown as gray mesh. The orientation of the chromophore on the right is rotated 90° around the horizontal axis with respect to that on the left. Similar to panel (b), green and yellow chromophores for trans- and cis-configurations are overlaid for clarity. Residue enumeration is shown in Figure 1.
Figure 9
Figure 9
Location in mTagFT of internal and external mutations compared to TagRFP. (a) Cartoon representation of the overall red mTagFT monomer. Chromophore, β-sheets, α-helixes, and loop regions are shown in pink, yellow, red, and green colors, respectively. The orientation of the panel on the right is rotated 90° around the horizontal axis with respect to that on the left. Mutations in mTagFT compared to TagRFP internal and external to the β-barrel are shown in blue and light blue colors, respectively. (b) Overlay of mTagFT and mKate crystal structures. The IF1 and IF2 interfaces in the mKate tetramer are labeled. Tetramers are superposed by one protein chain shown in yellow only for mTagFT for clarity. Substituted residues are depicted for this subunit as in panel (a). Note that in the case of mTagFT, the tetramer is an artifact of crystal packing and is not stable but is shown for comparison with the mKate tetramer. Residue enumeration is shown in Figure 1.

References

    1. Terskikh A., Fradkov A., Ermakova G., Zaraisky A., Tan P., Kajava A.V., Zhao X., Lukyanov S., Matz M., Kim S., et al. “Fluorescent timer”: Protein that changes color with time. Science. 2000;290:1585–1588. doi: 10.1126/science.290.5496.1585. - DOI - PubMed
    1. Subach F.V., Subach O.M., Gundorov I.S., Morozova K.S., Piatkevich K.D., Cuervo A.M., Verkhusha V.V. Monomeric fluorescent timers that change color from blue to red report on cellular trafficking. Nat. Chem. Biol. 2009;5:118–126. doi: 10.1038/nchembio.138. - DOI - PMC - PubMed
    1. Okuyama T., Kitamura T., Roy D.S., Itohara S., Tonegawa S. Ventral CA1 neurons store social memory. Science. 2016;353:1536–1541. doi: 10.1126/science.aaf7003. - DOI - PMC - PubMed
    1. Alber A.B., Paquet E.R., Biserni M., Naef F., Suter D.M. Single Live Cell Monitoring of Protein Turnover Reveals Intercellular Variability and Cell-Cycle Dependence of Degradation Rates. Mol. Cell. 2018;71:1079–1091.e9. doi: 10.1016/j.molcel.2018.07.023. - DOI - PubMed
    1. Tsuboi T., Kitaguchi T., Karasawa S., Fukuda M., Miyawaki A. Age-dependent preferential dense-core vesicle exocytosis in neuroendocrine cells revealed by newly developed monomeric fluorescent timer protein. Mol. Biol. Cell. 2010;21:87–94. doi: 10.1091/mbc.e09-08-0722. - DOI - PMC - PubMed

LinkOut - more resources