

The Interplay of Type 1, Type 2, and Type 3 Lymphocytes and Cytokines in Atopic Dermatitis
- PMID: 36834723
- PMCID: PMC9960233
- DOI: 10.3390/ijms24043310
The Interplay of Type 1, Type 2, and Type 3 Lymphocytes and Cytokines in Atopic Dermatitis
Abstract
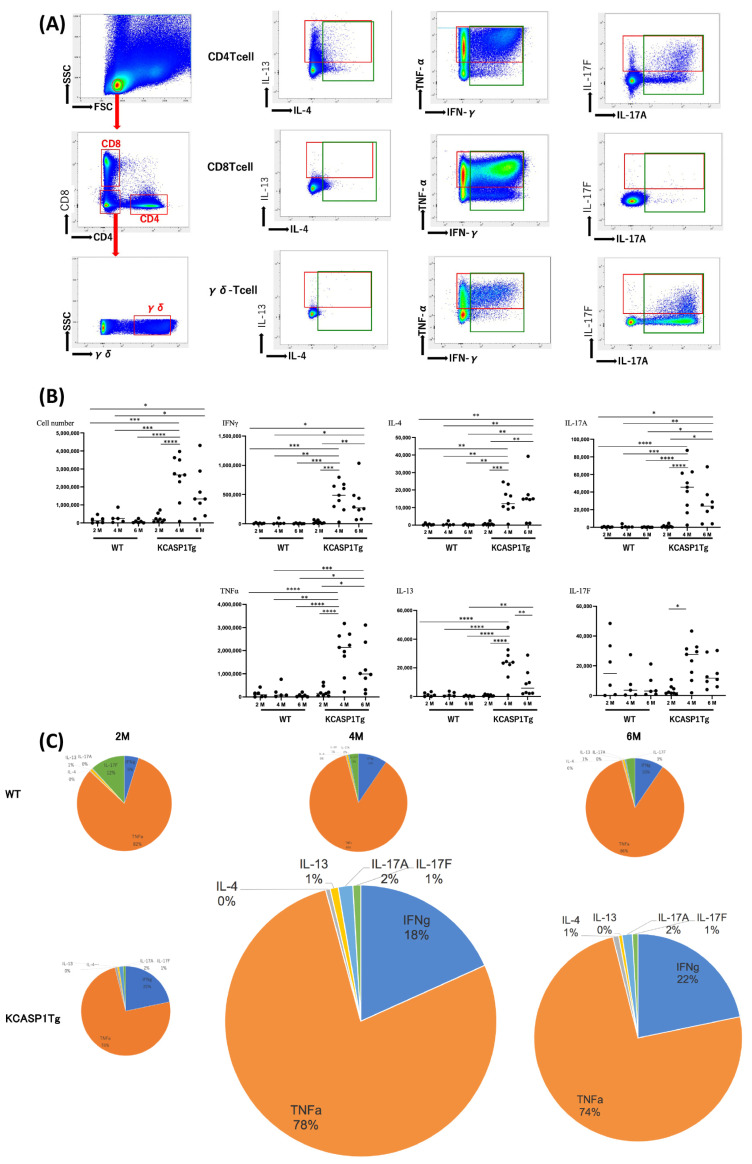
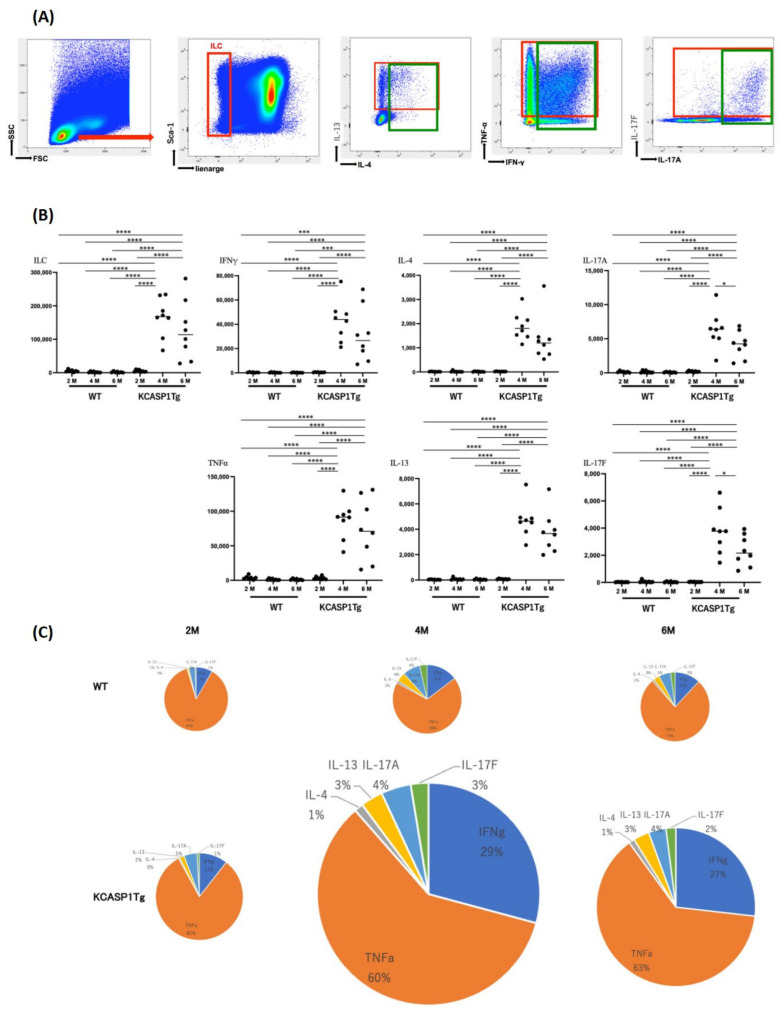
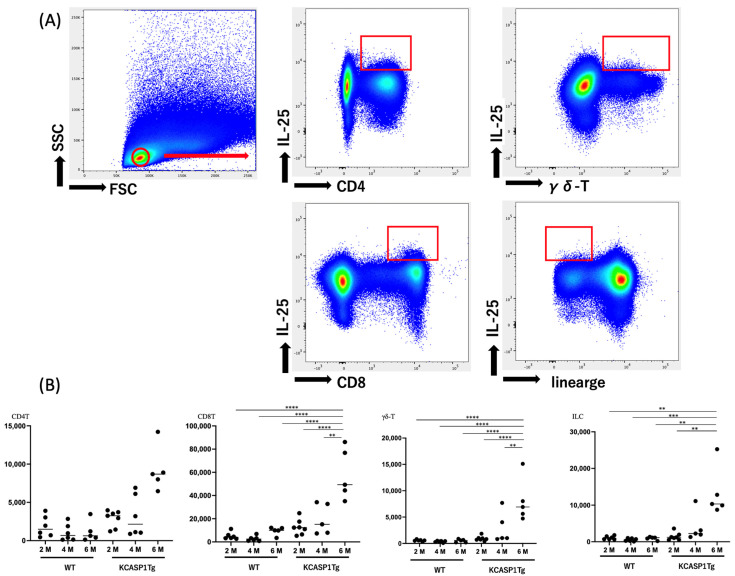
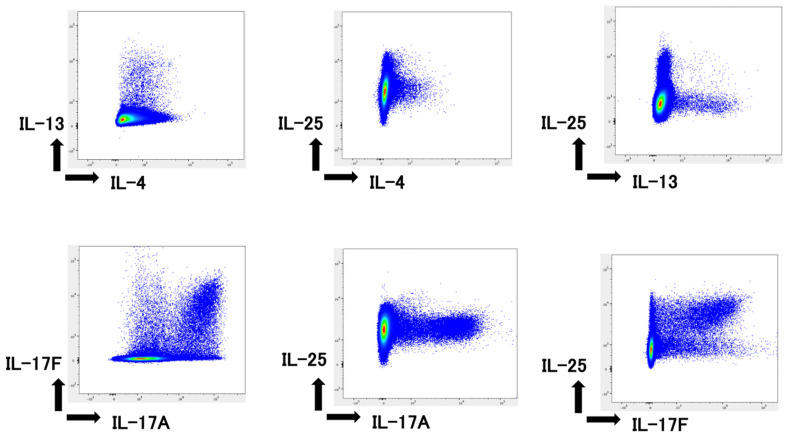
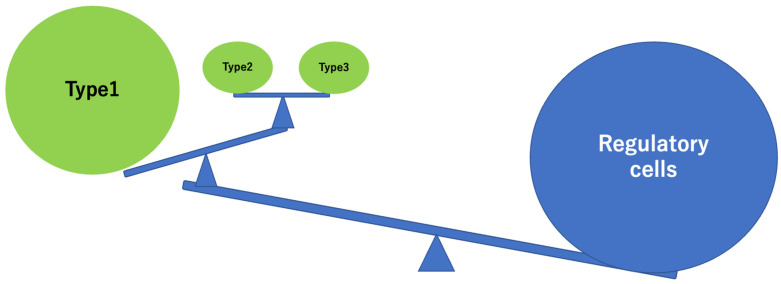
Atopic dermatitis (AD) is classified as a type 2 disease owing to the majority of type 2 lymphocytes that constitute the skin-infiltrating leukocytes. However, all of the type 1-3 lymphocytes intermingle in inflamed skin lesions. Here, using an AD mouse model where caspase-1 was specifically amplified under keratin-14 induction, we analyzed the sequential changes in type 1-3 inflammatory cytokines in lymphocytes purified from the cervical lymph nodes. Cells were cultured and stained for CD4, CD8, and γδTCR, followed by intracellular cytokines. Cytokine production in innate lymphocyte cells (ILCs) and the protein expression of type 2 cytokine IL-17E (IL-25) were investigated. We observed that, as inflammation progresses, the cytokine-producing T cells increased and abundant IL-13 but low levels of IL-4 are produced in CD4-positive T cells and ILCs. TNF-α and IFN-γ levels increased continuously. The total number of T cells and ILCs peaked at 4 months and decreased in the chronic phase. In addition, IL-25 may be simultaneously produced by IL-17F-producing cells. IL-25-producing cells increased in a time-dependent manner during the chronic phase and may work specifically for the prolongation of type 2 inflammation. Altogether, these findings suggest that inhibition of IL-25 may be a potential target in the treatment of inflammation.
Keywords: atopic dermatitis; cytokine; inflammatory skin mouse model; interleukin-17E; interleukin-25; type 2 inflammation.
Conflict of interest statement
The authors declare no conflict of interest. The funders had no role in the design of the study; in the collection, analyses, or interpretation of data; in the writing of the manuscript; or in the decision to publish the results.
Figures
Similar articles
-
Predominance of type 2 cytokine-producing CD4+ and CD8+ cells in patients with atopic dermatitis.J Allergy Clin Immunol. 1997 May;99(5):673-82. doi: 10.1016/s0091-6749(97)70030-7. J Allergy Clin Immunol. 1997. PMID: 9155835
-
Increased type 2 cytokine expression by both CD4+ CD45RO+ T cells and CD8+ CD45RO+ T cells in blood circulation is associated with high serum IgE but not with atopic dermatitis.J Invest Dermatol. 1998 Dec;111(6):1079-84. doi: 10.1046/j.1523-1747.1998.00454.x. J Invest Dermatol. 1998. PMID: 9856820
-
Intracellular production of IL-2, IL-4, IFN-gamma, and TNF-alpha by peripheral blood CD3+ and CD4+ T cells in children with atopic dermatitis.Eur J Pediatr. 2007 Aug;166(8):789-95. doi: 10.1007/s00431-006-0319-5. Epub 2006 Nov 21. Eur J Pediatr. 2007. PMID: 17120040
-
Innate lymphoid cells: a new key player in atopic dermatitis.Front Immunol. 2023 Oct 16;14:1277120. doi: 10.3389/fimmu.2023.1277120. eCollection 2023. Front Immunol. 2023. PMID: 37908364 Free PMC article. Review.
-
Interleukin-17 family cytokines in protective immunity against infections: role of hematopoietic cell-derived and non-hematopoietic cell-derived interleukin-17s.Microbiol Immunol. 2018 Jan;62(1):1-13. doi: 10.1111/1348-0421.12560. Microbiol Immunol. 2018. PMID: 29205464 Review.
Cited by
-
Increased Mortality Risk at Septic Condition in Inflammatory Skin Disorders and the Effect of High-Fat Diet Consumption.Int J Mol Sci. 2023 Dec 29;25(1):478. doi: 10.3390/ijms25010478. Int J Mol Sci. 2023. PMID: 38203647 Free PMC article.
-
Editorial: Special Issue, "Molecular Advances in Skin Diseases 2.0".Int J Mol Sci. 2024 May 29;25(11):5928. doi: 10.3390/ijms25115928. Int J Mol Sci. 2024. PMID: 38892115 Free PMC article.
-
Enhanced Innate Immunity Mediated by IL-36α in Atopic Dermatitis and Differences in Cytokine Profiles of Lymphocytes in the Skin and Draining Lymph Nodes.Biomolecules. 2025 Jun 4;15(6):817. doi: 10.3390/biom15060817. Biomolecules. 2025. PMID: 40563457 Free PMC article.
References
-
- Imai Y., Yasuda K., Nagai M., Kusakabe M., Kubo M., Nakanishi K., Yamanishi K. IL-33-Induced Atopic Dermatitis-like Inflammation in Mice Is Mediated by Group 2 Innate Lymphoid Cells in Concert with Basophils. J. Investig. Dermatol. 2019;139:2185–2194.e83. doi: 10.1016/j.jid.2019.04.016. - DOI - PubMed
-
- Imai Y., Yasuda K., Sakaguchi Y., Haneda T., Mizutani H., Yoshimoto T., Nakanishi K., Yamanishi K. Skin-specific expression of IL-33 activates group 2 innate lymphoid cells and elicits atopic dermatitis-like inflammation in mice. Proc. Natl. Acad. Sci. USA. 2013;110:13921–13926. doi: 10.1073/pnas.1307321110. - DOI - PMC - PubMed
-
- Konishi H., Tsutsui H., Murakami T., Yumikura-Futatsugi S., Yamanaka K., Tanaka M., Iwakura Y., Suzuki N., Takeda K., Akira S., et al. IL-18 contributes to the spontaneous development of atopic dermatitis-like inflammatory skin lesion independently of IgE/stat6 under specific pathogen-free conditions. Proc. Natl. Acad. Sci. USA. 2002;99:11340–11345. doi: 10.1073/pnas.152337799. - DOI - PMC - PubMed
-
- Gittler J.K., Shemer A., Suarez-Farinas M., Fuentes-Duculan J., Gulewicz K.J., Wang C.Q., Mitsui H., Cardinale I., de Guzman Strong C., Krueger J.G., et al. Progressive activation of T(H)2/T(H)22 cytokines and selective epidermal proteins characterizes acute and chronic atopic dermatitis. J. Allergy Clin. Immunol. 2012;130:1344–1354. doi: 10.1016/j.jaci.2012.07.012. - DOI - PMC - PubMed
MeSH terms
Substances
Grants and funding
LinkOut - more resources
Full Text Sources
Research Materials
