

Increased Levels of (p)ppGpp Correlate with Virulence and Biofilm Formation, but Not with Growth, in Strains of Uropathogenic Escherichia coli
- PMID: 36834725
- PMCID: PMC9962837
- DOI: 10.3390/ijms24043315
Increased Levels of (p)ppGpp Correlate with Virulence and Biofilm Formation, but Not with Growth, in Strains of Uropathogenic Escherichia coli
Abstract
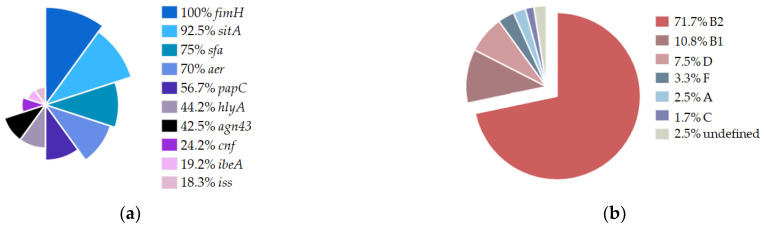
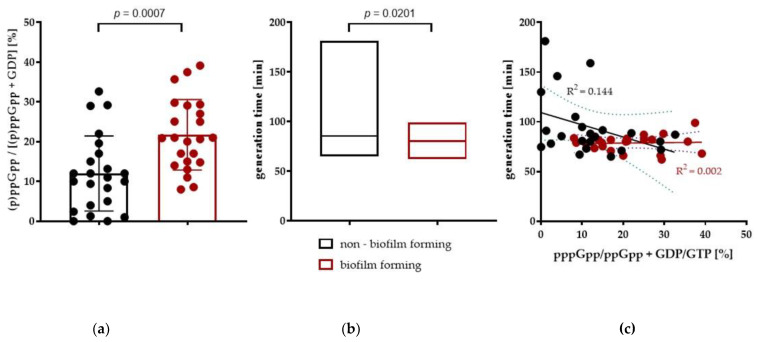
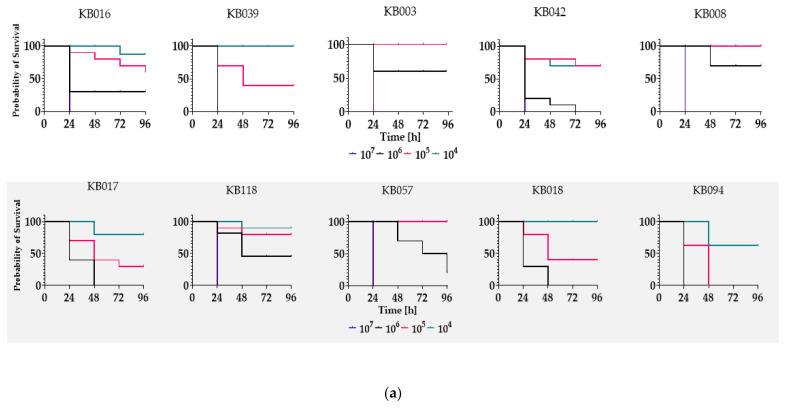
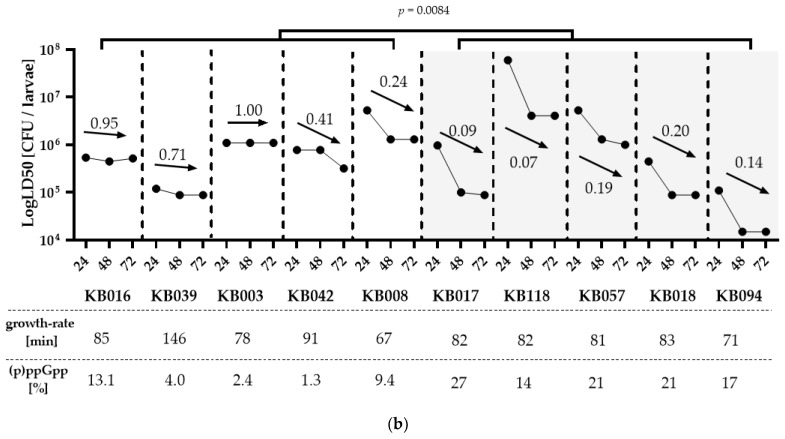
Urinary tract infections are one of the most frequent bacterial diseases worldwide. UPECs are the most prominent group of bacterial strains among pathogens responsible for prompting such infections. As a group, these extra-intestinal infection-causing bacteria have developed specific features that allow them to sustain and develop in their inhabited niche of the urinary tract. In this study, we examined 118 UPEC isolates to determine their genetic background and antibiotic resistance. Moreover, we investigated correlations of these characteristics with the ability to form biofilm and to induce a general stress response. We showed that this strain collection expressed unique UPEC attributes, with the highest representation of FimH, SitA, Aer, and Sfa factors (100%, 92.5%, 75%, and 70%, respectively). According to CRA (Congo red agar) analysis, the strains particularly predisposed to biofilm formation represented 32.5% of the isolates. Those biofilm forming strains presented a significant ability to accumulate multi-resistance traits. Most notably, these strains presented a puzzling metabolic phenotype-they showed elevated basal levels of (p)ppGpp in the planktonic phase and simultaneously exhibited a shorter generation time when compared to non-biofilm-forming strains. Moreover, our virulence analysis showed these phenotypes to be crucial for the development of severe infections in the Galleria mellonella model.
Keywords: E. coli; Galleria mellonella; UPEC; UTI; antibiotic resistance; biofilm; infection; pathogenicity; phenotype; ppGpp; stringent response; virulence.
Conflict of interest statement
The authors declare no conflict of interest.
Figures
Similar articles
-
A systematic review and meta-analysis of antibiotic resistance patterns, and the correlation between biofilm formation with virulence factors in uropathogenic E. coli isolated from urinary tract infections.Microb Pathog. 2020 Jul;144:104196. doi: 10.1016/j.micpath.2020.104196. Epub 2020 Apr 10. Microb Pathog. 2020. PMID: 32283258
-
Virulence genes and phylogenetic groups of uropathogenic Escherichia coli isolates from patients with urinary tract infection and uninfected control subjects: a case-control study.BMC Infect Dis. 2021 Apr 17;21(1):361. doi: 10.1186/s12879-021-06036-4. BMC Infect Dis. 2021. PMID: 33865334 Free PMC article.
-
Comprehensive phenotypic and genotypic characterization and comparison of virulence, biofilm, and antimicrobial resistance in urinary Escherichia coli isolated from canines.Vet Microbiol. 2020 Oct;249:108822. doi: 10.1016/j.vetmic.2020.108822. Epub 2020 Aug 13. Vet Microbiol. 2020. PMID: 32937249
-
Distribution of virulence genes and phylogenetics of uropathogenic Escherichia coli among urinary tract infection patients in Addis Ababa, Ethiopia.BMC Infect Dis. 2020 Feb 7;20(1):108. doi: 10.1186/s12879-020-4844-z. BMC Infect Dis. 2020. PMID: 32033541 Free PMC article.
-
Virulence factors and antimicrobial resistance of uropathogenic Escherichia coli (UPEC) isolated from urinary tract infections: a systematic review and meta-analysis.BMC Infect Dis. 2021 Aug 4;21(1):753. doi: 10.1186/s12879-021-06435-7. BMC Infect Dis. 2021. PMID: 34348646 Free PMC article.
Cited by
-
Uropathogenic Escherichia coli (UPEC)-Associated Urinary Tract Infections: The Molecular Basis for Challenges to Effective Treatment.Microorganisms. 2023 Aug 28;11(9):2169. doi: 10.3390/microorganisms11092169. Microorganisms. 2023. PMID: 37764013 Free PMC article. Review.
-
Fluid flow drives phenotypic heterogeneity in bacterial growth and adhesion on surfaces.Nat Commun. 2024 Jul 22;15(1):6161. doi: 10.1038/s41467-024-49997-1. Nat Commun. 2024. PMID: 39039040 Free PMC article.
-
Comparative analysis of virulence gene profiles of Escherichia coli from human and non-human sources in Rivers State, Nigeria.Access Microbiol. 2024 Jul 25;6(7):000776.v6. doi: 10.1099/acmi.0.000776.v6. eCollection 2024. Access Microbiol. 2024. PMID: 39130738 Free PMC article.
References
-
- Boon H.A., Struyf T., Crevecoeur J., Delvaux N., Van Pottelbergh G., Vaes B., Van den Bruel A., Verbakel J.Y. Incidence rates and trends of childhood urinary tract infections and antibiotic prescribing: Registry-based study in general practices (2000 to 2020) BMC Prim. Care. 2022;23:177. doi: 10.1186/s12875-022-01784-x. - DOI - PMC - PubMed
-
- Zhu C., Wang D.Q., Zi H., Huang Q., Gu J.M., Li L.Y., Guo X.P., Li F., Fang C., Li X.D., et al. Epidemiological trends of urinary tract infections, urolithiasis and benign prostatic hyperplasia in 203 countries and territories from 1990 to 2019. Mil. Med. Res. 2021;8:64. doi: 10.1186/s40779-021-00359-8. - DOI - PMC - PubMed
MeSH terms
Substances
Grants and funding
LinkOut - more resources
Full Text Sources
Medical
Research Materials
