

CB2 Receptor as Emerging Anti-Inflammatory Target in Duchenne Muscular Dystrophy
- PMID: 36834757
- PMCID: PMC9964283
- DOI: 10.3390/ijms24043345
CB2 Receptor as Emerging Anti-Inflammatory Target in Duchenne Muscular Dystrophy
Abstract
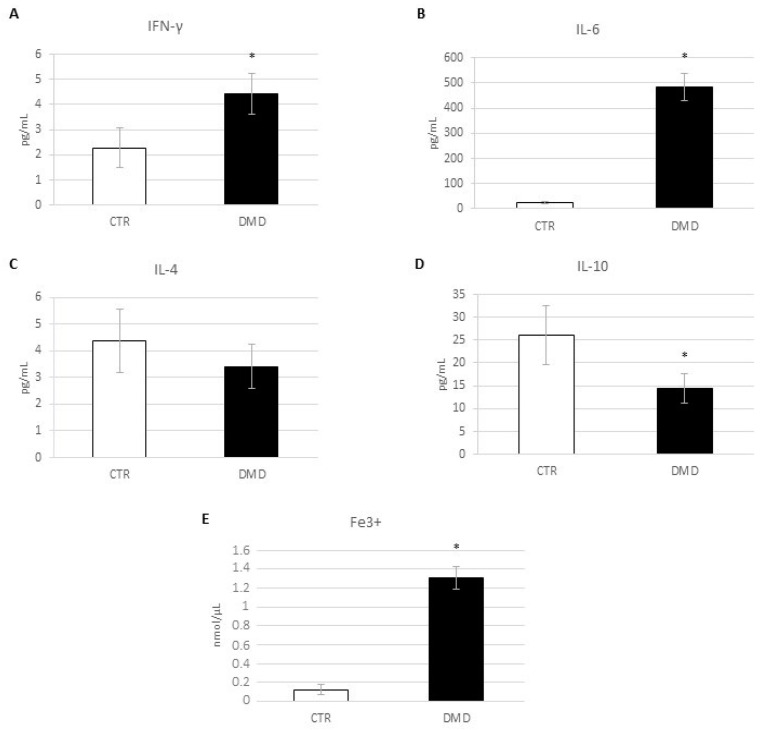
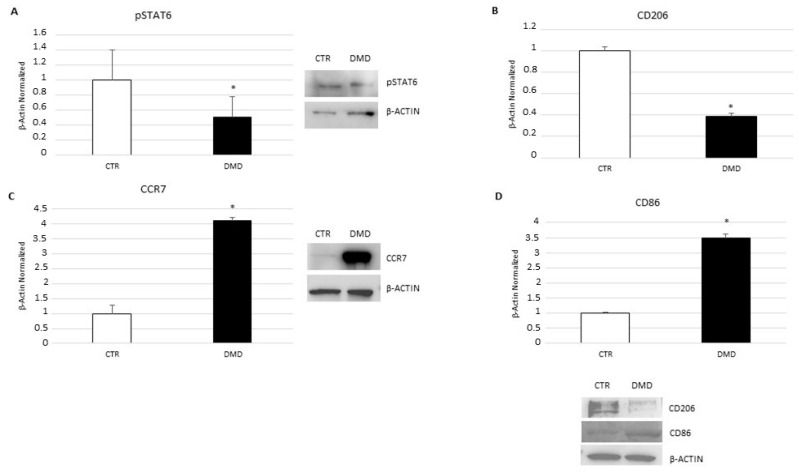
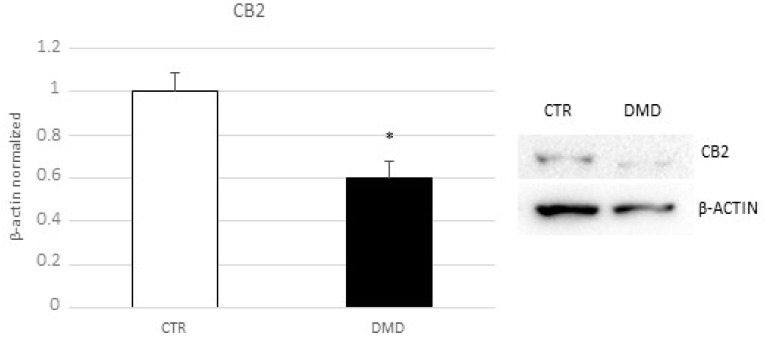
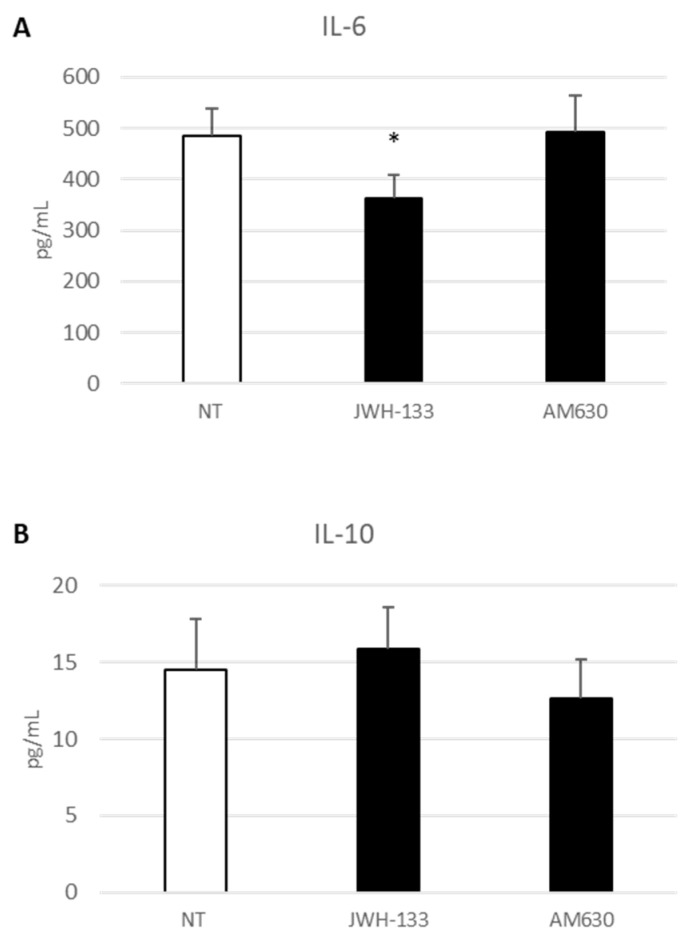
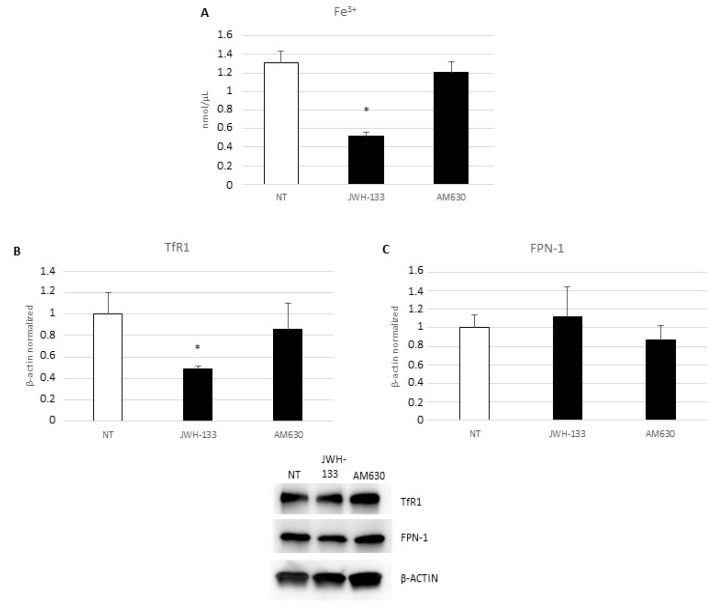
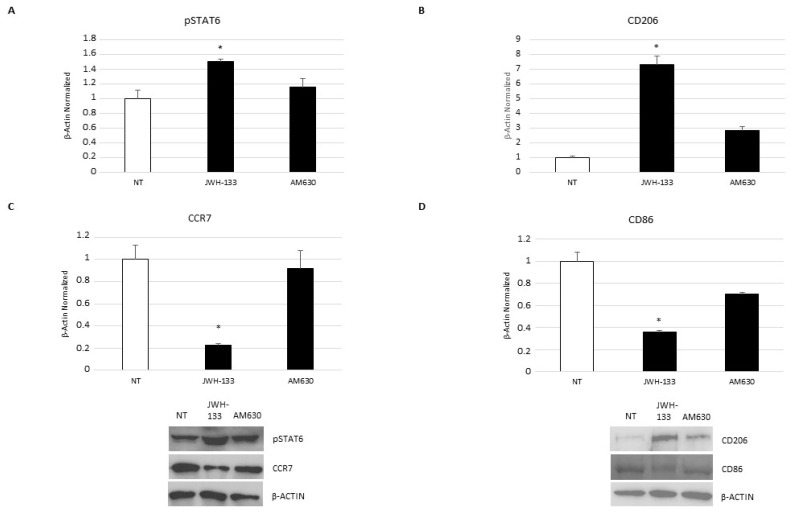
Duchenne Muscular Dystrophy (DMD) is a very severe X-linked dystrophinopathy. It is due to a mutation in the DMD gene and causes muscular degeneration in conjunction with several secondary co-morbidities, such cardiomyopathy and respiratory failure. DMD is characterized by a chronic inflammatory state, and corticosteroids represent the main therapy for these patients. To contradict drug-related side effects, there is need for novel and more safe therapeutic strategies. Macrophages are immune cells stringently involved in both physiological and pathological inflammatory processes. They express the CB2 receptor, one of the main elements of the endocannabinoid system, and have been proposed as an anti-inflammatory target in several inflammatory and immune diseases. We observed a lower expression of the CB2 receptor in DMD-associated macrophages, hypothesizing its involvement in the pathogenesis of this pathology. Therefore, we analyzed the effect of JWH-133, a CB2 receptor selective agonist, on DMD-associated primary macrophages. Our study describes the beneficial effect of JWH-133 in counteracting inflammation by inhibiting pro-inflammatory cytokines release and by directing macrophages' phenotype toward the M2 anti-inflammatory one.
Keywords: CB2 receptor; Duchenne muscular dystrophy; inflammation; macrophage phenotype.
Conflict of interest statement
The authors declare no conflict of interest.
Figures
Similar articles
-
Interventions for preventing and treating cardiac complications in Duchenne and Becker muscular dystrophy and X-linked dilated cardiomyopathy.Cochrane Database Syst Rev. 2018 Oct 16;10(10):CD009068. doi: 10.1002/14651858.CD009068.pub3. Cochrane Database Syst Rev. 2018. PMID: 30326162 Free PMC article.
-
The X-linked Becker muscular dystrophy (bmx) mouse models Becker muscular dystrophy via deletion of murine dystrophin exons 45-47.J Cachexia Sarcopenia Muscle. 2023 Apr;14(2):940-954. doi: 10.1002/jcsm.13171. Epub 2023 Jan 11. J Cachexia Sarcopenia Muscle. 2023. PMID: 36628607 Free PMC article.
-
Skeletal muscle secretome in Duchenne muscular dystrophy: a pivotal anti-inflammatory role of adiponectin.Cell Mol Life Sci. 2017 Jul;74(13):2487-2501. doi: 10.1007/s00018-017-2465-5. Epub 2017 Feb 10. Cell Mol Life Sci. 2017. PMID: 28188344 Free PMC article.
-
Zidovudine ameliorates pathology in the mouse model of Duchenne muscular dystrophy via P2RX7 purinoceptor antagonism.Acta Neuropathol Commun. 2018 Apr 11;6(1):27. doi: 10.1186/s40478-018-0530-4. Acta Neuropathol Commun. 2018. PMID: 29642926 Free PMC article.
-
Synaptic alterations as a neurodevelopmental trait of Duchenne muscular dystrophy.Neurobiol Dis. 2022 Jun 15;168:105718. doi: 10.1016/j.nbd.2022.105718. Epub 2022 Apr 4. Neurobiol Dis. 2022. PMID: 35390481 Review.
Cited by
-
Molecular Advances on Cannabinoid and Endocannabinoid Research.Int J Mol Sci. 2023 Aug 14;24(16):12760. doi: 10.3390/ijms241612760. Int J Mol Sci. 2023. PMID: 37628940 Free PMC article.
-
CB2 and TRPV1 receptors in inflammatory state of macrophages from sickle cell anemia pediatric/young adults.Sci Rep. 2025 Aug 8;15(1):29040. doi: 10.1038/s41598-025-15028-2. Sci Rep. 2025. PMID: 40781148 Free PMC article.
-
Ameliorative Role of β-Caryophyllene on Antioxidant Biomarkers in a Paroxetine-Induced Model of Male Sexual Dysfunction.Basic Clin Pharmacol Toxicol. 2025 Mar;136(3):e70010. doi: 10.1111/bcpt.70010. Basic Clin Pharmacol Toxicol. 2025. PMID: 39960010 Free PMC article.
-
Stress exposure in the mdx mouse model of Duchenne muscular dystrophy provokes a widespread metabolic response.FEBS J. 2025 Feb 22:10.1111/febs.70029. doi: 10.1111/febs.70029. Online ahead of print. FEBS J. 2025. PMID: 39985215
-
Anti-Inflammatory and Anti-Fibrotic Effects of a Mixture of Polyphenols Extracted from "Navelina" Orange in Human Hepa-RG and LX-2 Cells Mediated by Cannabinoid Receptor 2.Int J Mol Sci. 2025 Jan 9;26(2):512. doi: 10.3390/ijms26020512. Int J Mol Sci. 2025. PMID: 39859241 Free PMC article.
References
MeSH terms
Substances
Grants and funding
LinkOut - more resources
Full Text Sources
Medical
