. 2023 Feb 8;24(4):3430.
doi: 10.3390/ijms24043430.

Synergistic Antifungal Interactions between Antibiotic Amphotericin B and Selected 1, 3, 4-thiadiazole Derivatives, Determined by Microbiological, Cytochemical, and Molecular Spectroscopic Studies

Affiliations

Synergistic Antifungal Interactions between Antibiotic Amphotericin B and Selected 1, 3, 4-thiadiazole Derivatives, Determined by Microbiological, Cytochemical, and Molecular Spectroscopic Studies

Agnieszka Dróżdż et al. Int J Mol Sci. .

Abstract

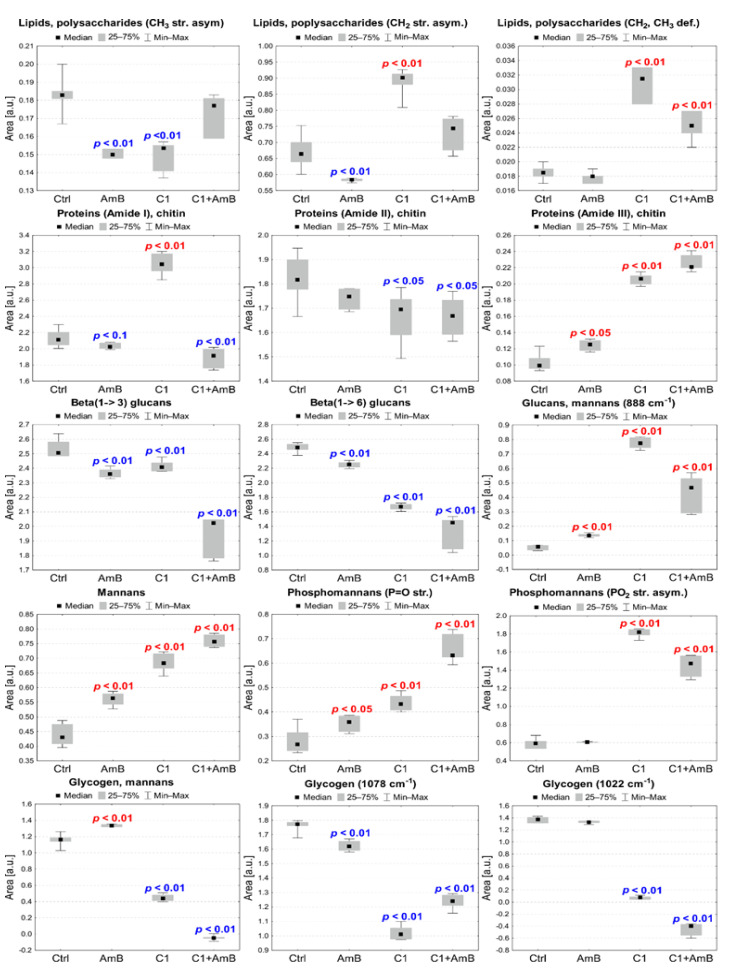
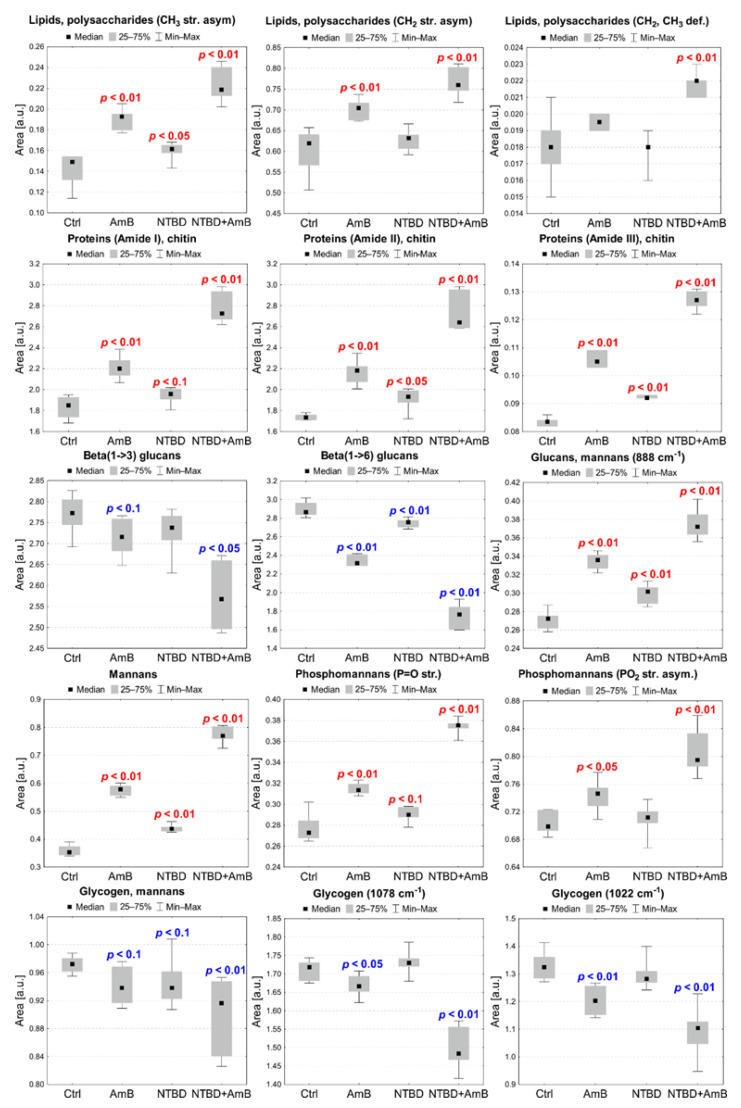
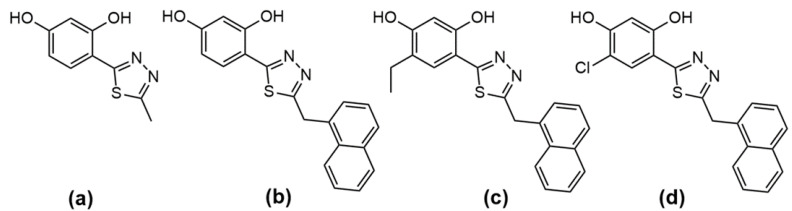
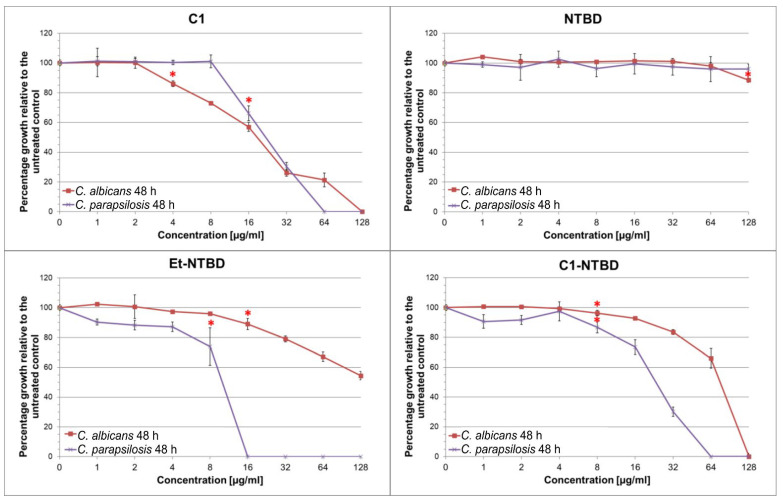
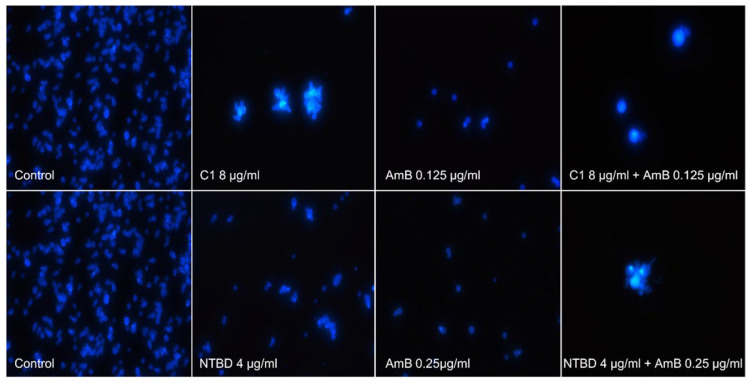
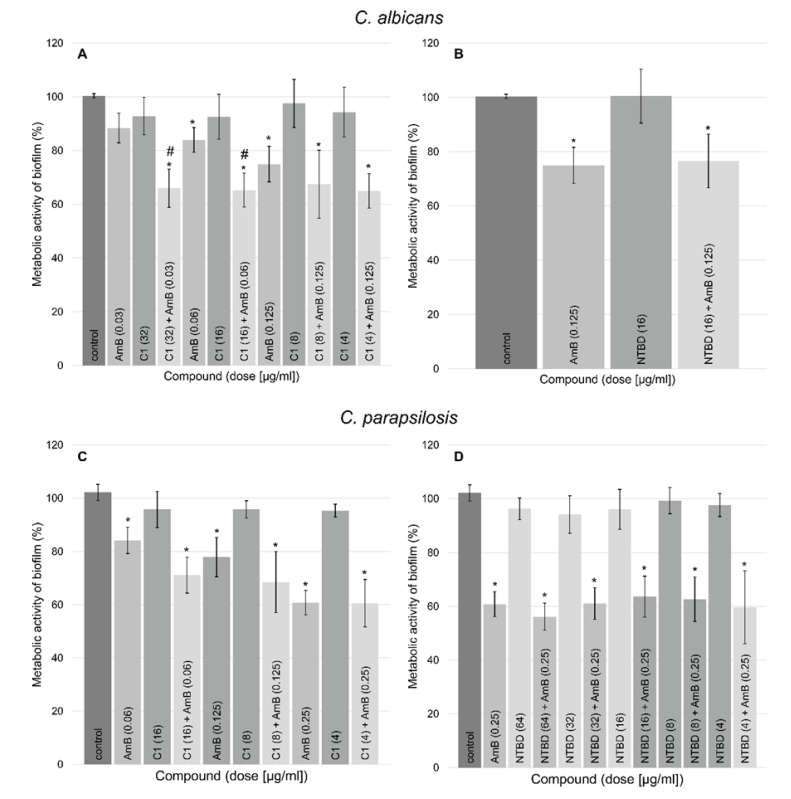
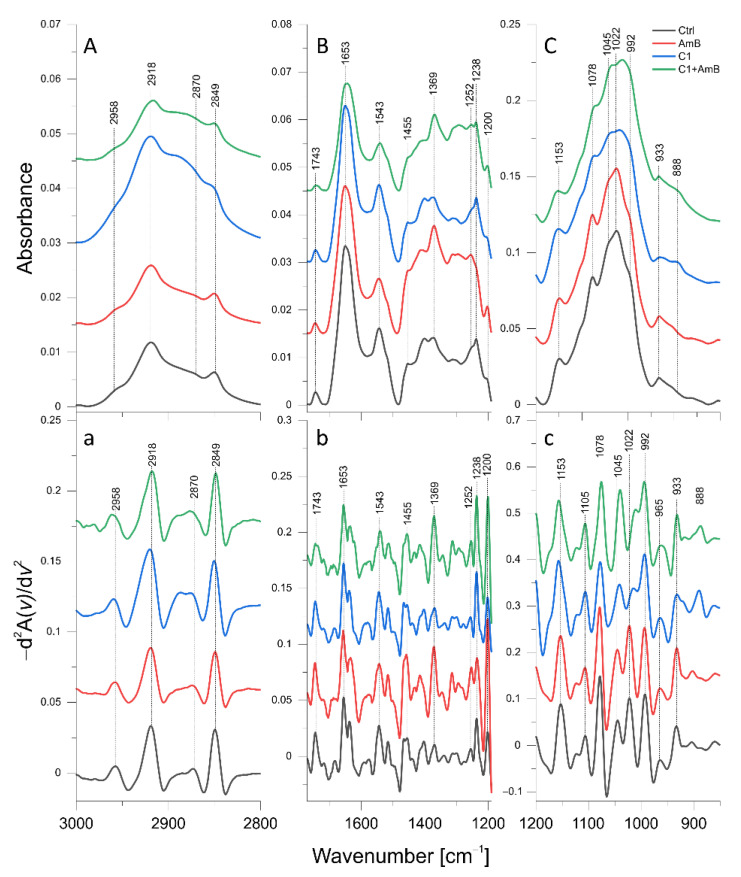
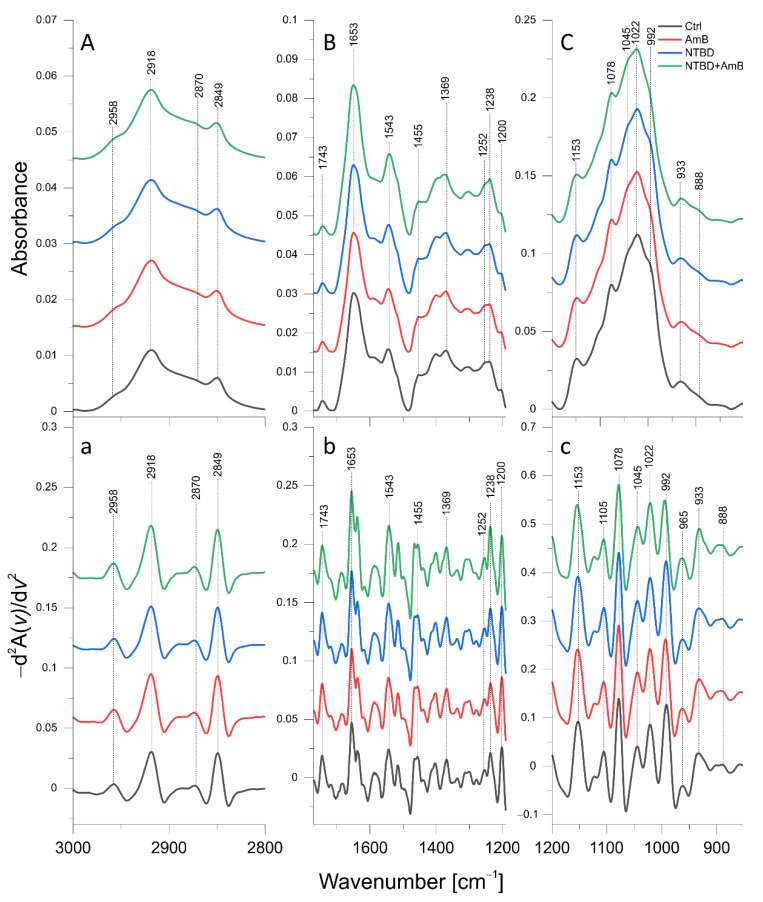
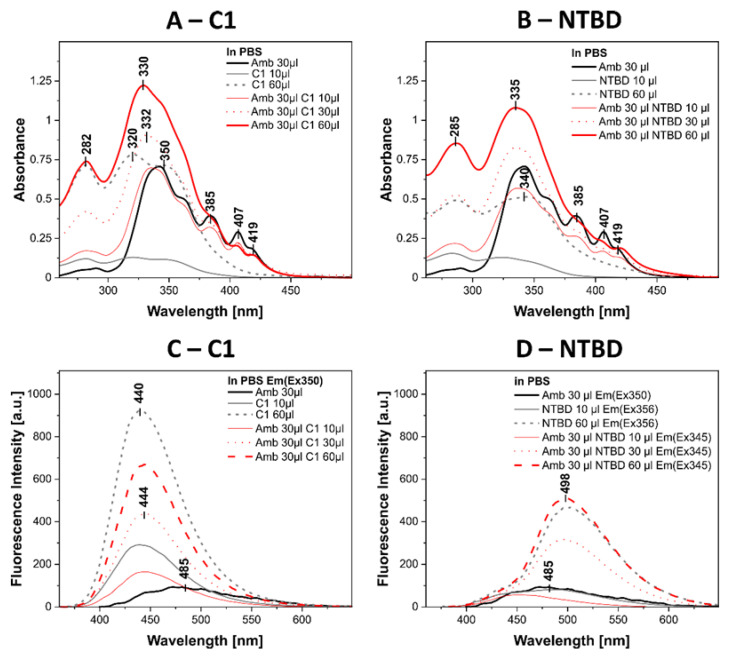
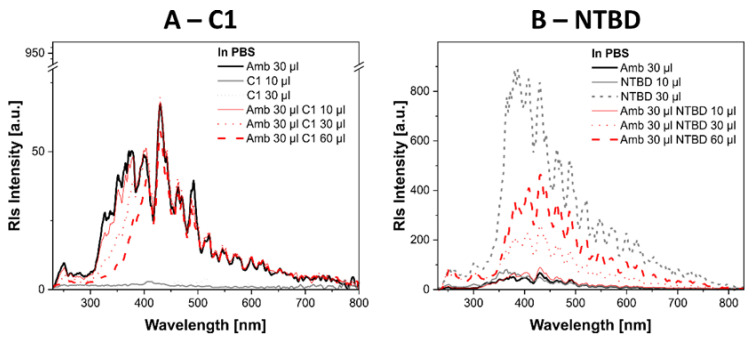
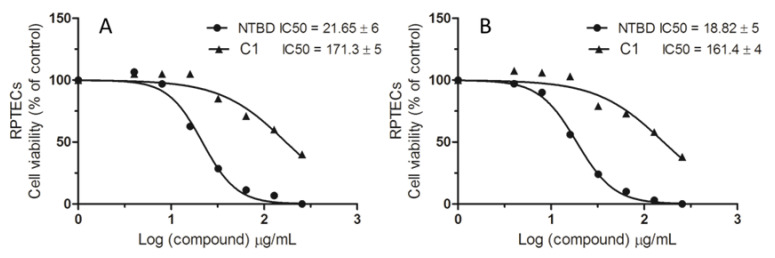
In recent years, drug-resistant and multidrug-resistant fungal strains have been more frequently isolated in clinical practice. This phenomenon is responsible for difficulties in the treatment of infections. Therefore, the development of new antifungal drugs is an extremely important challenge. Combinations of selected 1,3,4-thiadiazole derivatives with amphotericin B showing strong synergic antifungal interactions are promising candidates for such formulas. In the study, microbiological, cytochemical, and molecular spectroscopy methods were used to investigate the antifungal synergy mechanisms associated with the aforementioned combinations. The present results indicate that two derivatives, i.e., C1 and NTBD, demonstrate strong synergistic interactions with AmB against some Candida species. The ATR-FTIR analysis showed that yeasts treated with the C1 + AmB and NTBD + AmB compositions, compared with those treated with single compounds, exhibited more pronounced abnormalities in the biomolecular content, suggesting that the main mechanism of the synergistic antifungal activity of the compounds is related to a disturbance in cell wall integrity. The analysis of the electron absorption and fluorescence spectra revealed that the biophysical mechanism underlying the observed synergy is associated with disaggregation of AmB molecules induced by the 1,3,4-thiadiazole derivatives. Such observations suggest the possibility of the successful application of thiadiazole derivatives combined with AmB in the therapy of fungal infections.

Keywords: 1,3,4-thiadiazole derivatives; FTIR spectroscopy; amphotericin B; molecular aggregation; molecular spectroscopy; synergy mechanisms.


Conflict of interest statement

The authors declare no conflict of interest. The funders had no role in the design of the study; in the collection, analyses, or interpretation of data; in the writing of the manuscript, or in the decision to publish the results.

Figures

Figure 7
Figure 7
The median, minimal, and maximal values of intensities of selected absorption bands presenting differences between C. albicans exposed to AmB, C1, and C1 + AmB treatment and control (Ctrl) group. The p-values of Mann–Whitney U test for statistically significant changes compared with the control are placed on the charts (red—ncreases, blue—decreases).
Figure 8
Figure 8
Median, minimal, and maximal values of intensities of selected absorption bands showing differences between C. albicans exposed to the AmB, NTBD, and NTBD + AmB treatments and the control (Ctrl) group. The p-values of the Mann–Whitney U test for statistically significant changes compared with the control are placed on the charts (red—increases, blue—decreases).
Figure 1
Figure 1
Structures of the investigated thiadiazole derivatives: C1 (a), NTBD (b); Et-NTBD (c), and Cl-NTBD (d).
Figure 2
Figure 2
Effect of thiadiazoles on the growth of C. albicans NCPF 3153 and C. parapsilosis ATCC 22019. The percentage growth of thiadiazole-treated cells measured as OD600 relative to the control was calculated from the following equation: (OD600 of treated sample)/(OD600 of untreated sample) × 100; * represents the lowest concentration at which a statistically significant decrease in OD was noted, compared with the control (one-way ANOVA, Tukey’s post-hoc test).
Figure 3
Figure 3
Fluorescence microscopy images showing morphological changes in Candida cells treated with C1 and NTBD separately and in combination with AmB at the selected concentrations. After 24 h of culture, the cells were stained with calcofluor white (magnification 600×).
Figure 4
Figure 4
The MTT assay results presenting the analyzed compounds and combinations activity: (A)—AmB, C1, and C1+AmB activity against C. albicans biofilms, (B)—AmB, NTBD, and NTBD+AmB activity against C. albicans biofilms, (C)—AmB, C1, and C1+AmB activity against C. parapsilosis biofilms, (D)—AmB, NTBD, and NTBD+AmB activity against C. parapsilosis biofilms, *—the statistically significant differences (p < 5%) in the metabolic activity of Candida biofilms treated with AmB, thiadiazole derivatives and their combinations compared with the control, #—the statistically significant differences (p < 5%) in the metabolic activity Candida biofilms treated with thiadiazole derivatives + AmB compared with biofilms subjected to AmB.
Figure 5
Figure 5
Mean ATR-FTIR spectra for the control C. albicans cells and cells treated with AmB (0.03 µg/mL), C1 (8 µg/mL), and their combination, respectively: (A)—3000–2800 cm−1 region of ATR-FTIR spectra; (B)—1750–1190 cm−1 region of ATR-FTIR spectra; (C)—1200–800 cm−1 region of ATR- FTIR spectra; (ac)—reversed second derivatives of spectra presented in (AC).
Figure 6
Figure 6
Mean ATR-FTIR spectra of control C. albicans cells and cells treated with AmB (0.06 µg/mL), NTBD (4 µg/mL), and their combination: (A)—3000–2800 cm−1 region of ATR-FTIR spectra; (B)—1750–1190 cm−1 region of ATR-FTIR spectra; (C)—1200–800 cm−1 region of ATR- FTIR spectra; a–c—reversed second derivatives of spectra presented in (AC).
Figure 9
Figure 9
(A)—electron absorption spectra for C1, AmB, and the C1+AmB synergistic system in PBS buffer at varying concentrations of the compound. The molar concentration of AmB was 0.0107 mM, and the molar concentration of C1 was 0.0159 mM for the 10 μL dose and 0.0942 mM for 60 μL. The successive molar concentrations of C1 in the synergistic system were 0.0158 mM, 0.0471 mM, and 0.0933 mM; (B)—electron absorption spectra for NTBD, AmB, and the NTBD+AmB synergistic system in PBS buffer at varying concentrations of the compound. The molar concentration of AmB was 0.0107 mM, and the molar concentration of NTBD was 0.0099 mM for the 10 μL dose and 0.0587 mM for 60 μL. The successive molar concentrations of compound NTBD were 0.0098 mM, 0.0294 mM, and 0.0581 mM; (C)—electron emission spectra corresponding to the absorption spectra in A; (D)—electron emission spectra corresponding to the absorption spectra in B.
Figure 10
Figure 10
(A)—resonance light scattering spectra of C1, AmB, and the synergistic C1 + AmB system corresponding to the spectra in Figure 9A,C (analogous concentrations); (B)—resonance light scattering spectra of NTBD, AmB, and the synergistic NTBD + AmB system corresponding to the spectra in Figure 9B,D (analogous concentrations).
Figure 11
Figure 11
Fitting of drug dose-response curve to yield half-maximal inhibitory concentration. The cells were treated with C1 and NTBD (0–256 μg/mL) for 24 h (A) and 48 h (B) and MTT assay was performed. The IC50 value was estimated by non-linear regression analysis.

References

    1. Kainz K., Bauer M.A., Madeo F., Carmona-Gutierrez D. Fungal infections in humans: The silent crisis. Microb. Cell. 2020;7:143–145. doi: 10.15698/mic2020.06.718. - DOI - PMC - PubMed
    1. Bhattacharya S., Sae-Tia S., Fries B.C. Candidiasis and Mechanisms of Antifungal Resistance. Antibiotics. 2020;9:312. doi: 10.3390/antibiotics9060312. - DOI - PMC - PubMed
    1. Kontoyiannis D.P., Lewis R.E. Antifungal drug resistance of pathogenic fungi. Lancet. 2002;359:1135–1144. doi: 10.1016/S0140-6736(02)08162-X. - DOI - PubMed
    1. Pappas P.G. Opportunistic fungi: A view to the future. Am. J. Med. Sci. 2010;340:253–257. doi: 10.1097/MAJ.0b013e3181e99c88. - DOI - PubMed
    1. Janniger E.J., Kapila R. Public health issues with Candida auris in COVID-19 patients. World Med. Health Policy. 2021;13:766–772. doi: 10.1002/wmh3.472. - DOI - PMC - PubMed

MeSH terms

LinkOut - more resources