

Inhibitory Effect of Styrylpyrone Extract of Phellinus linteus on Hepatic Steatosis in HepG2 Cells
- PMID: 36835095
- PMCID: PMC9959220
- DOI: 10.3390/ijms24043672
Inhibitory Effect of Styrylpyrone Extract of Phellinus linteus on Hepatic Steatosis in HepG2 Cells
Abstract
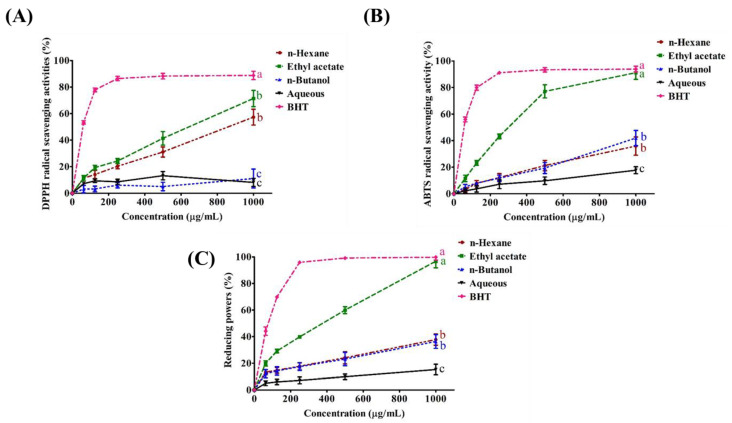
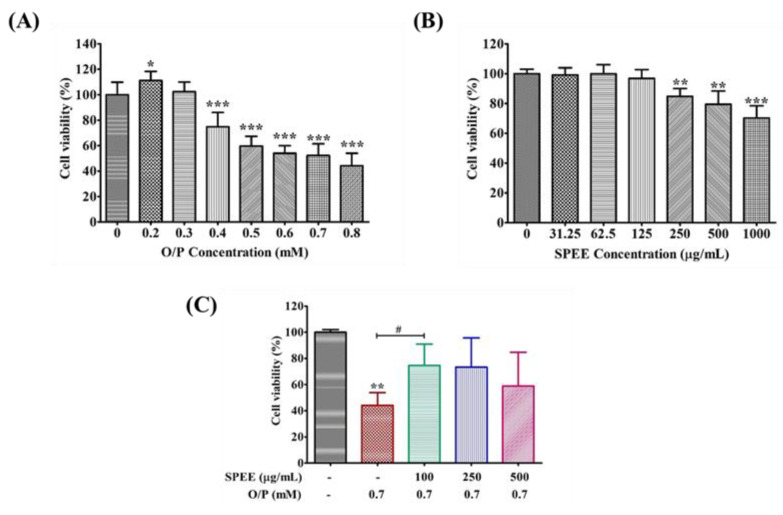
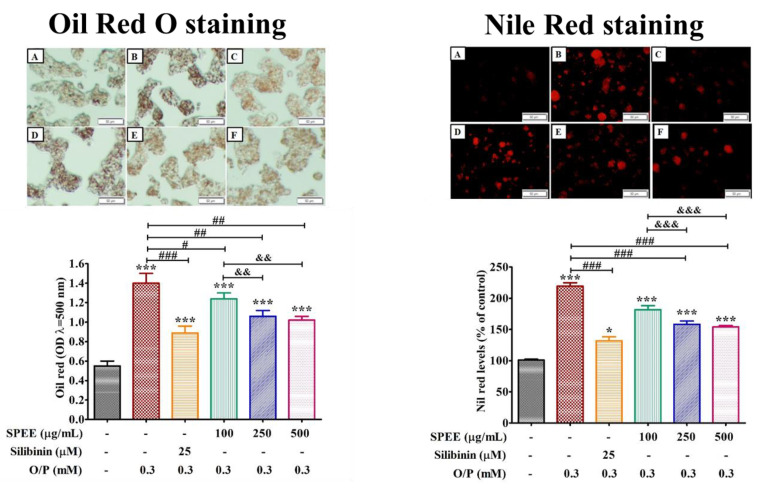
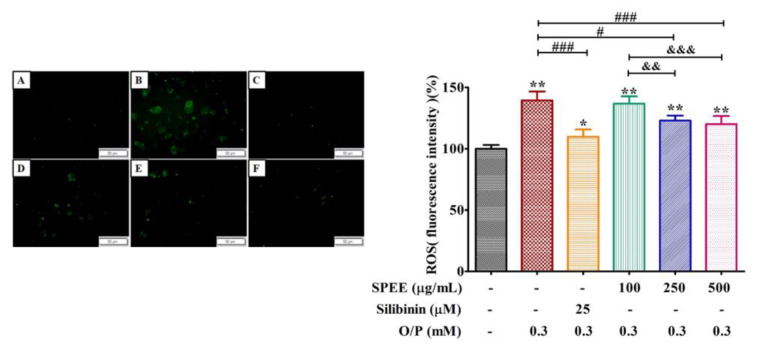
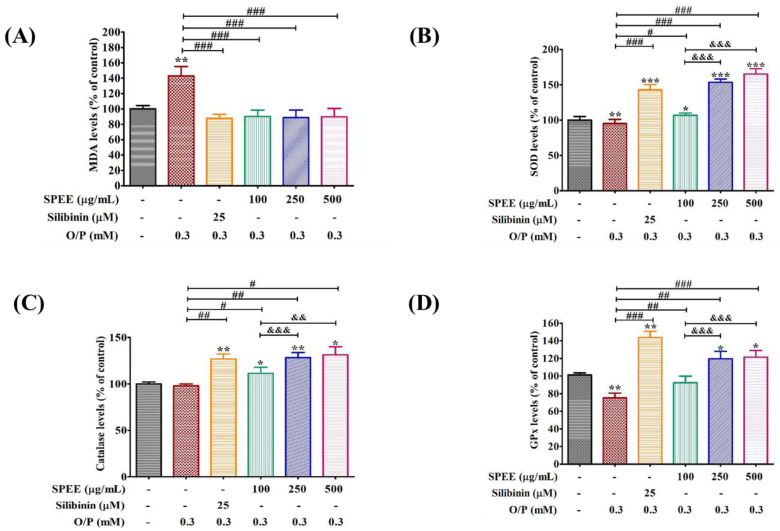
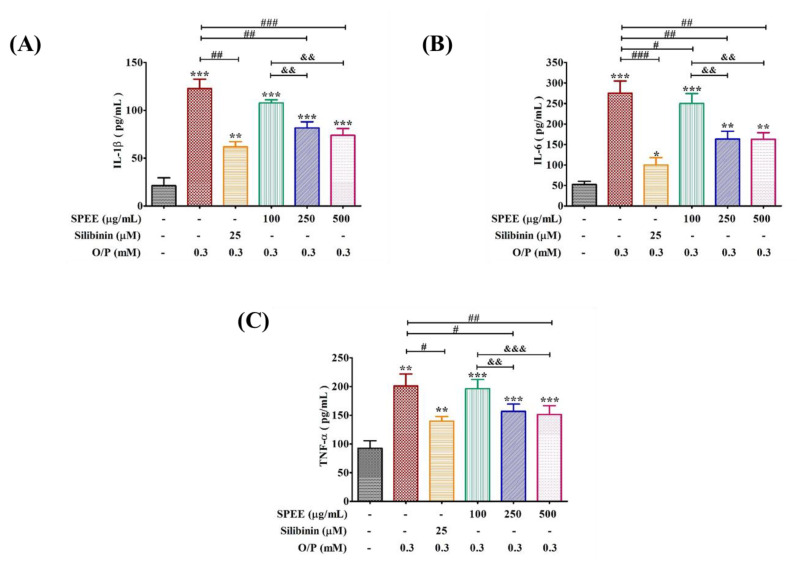
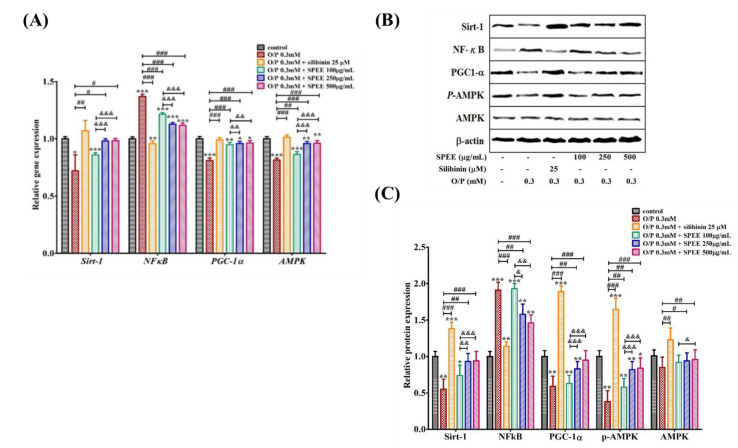
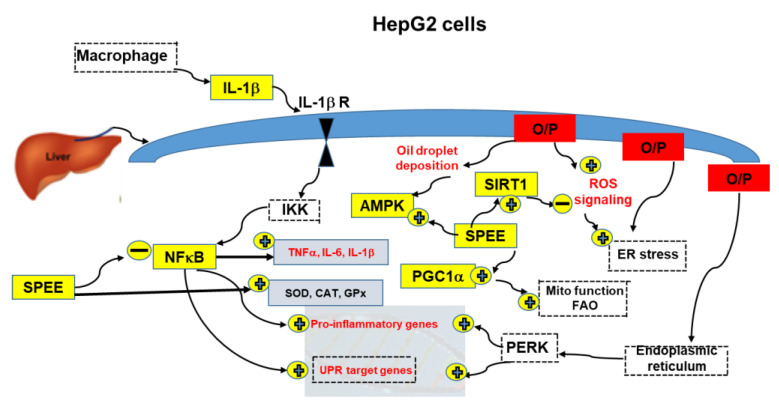
The prevalence of nonalcoholic fatty liver disease (NAFLD) is estimated to be approximately about 25.24% of the population worldwide. NAFLD is a complex syndrome and is characterized by a simple benign hepatocyte steatosis to more severe steatohepatitis in the liver pathology. Phellinus linteus (PL) is traditionally used as a hepatoprotective supplement. Styrylpyrone-enriched extract (SPEE) obtained from the PL mycelia has been shown to have potential inhibition effects on high-fat- and high-fructose-diet-induced NAFLD. In the continuous study, we aimed to explore the inhibitory effects of SPEE on free fatty acid mixture O/P [oleic acid (OA): palmitic acid (PA); 2:1, molar ratio]-induced lipid accumulation in HepG2 cells. Results showed that SPEE presented the highest free radical scavenging ability on DPPH and ABTS, and reducing power on ferric ions, better than that of partitions obtained from n-hexane, n-butanol and distilled water. In free-fatty-acid-induced lipid accumulation in HepG2 cells, SPEE showed an inhibition effect on O/P-induced lipid accumulation of 27% at a dosage of 500 μg/mL. As compared to the O/P induction group, the antioxidant activities of superoxide dismutase, glutathione peroxidase and catalase were enhanced by 73%, 67% and 35%, respectively, in the SPEE group. In addition, the inflammatory factors (TNF-α, IL-6 and IL-1β) were significantly down-regulated by the SPEE treatment. The expressions of anti-adipogenic genes involved in hepatic lipid metabolism of 5' adenosine monophosphate (AMP)-activated protein kinase (AMPK), sirtuin 1 (SIRT1) and peroxisome proliferator-activated receptor gamma coactivator 1-alpha (PGC-1α) were enhanced in the SPEE supplemented HepG2 cells. In the protein expression study, p-AMPK, SIRT1 and PGC1-α were significantly increased to 121, 72 and 62%, respectively, after the treatment of SPEE. Conclusively, the styrylpyrone-enriched extract SPEE can ameliorate lipid accumulation and decrease inflammation and oxidative stress through the activation of SIRT1/AMPK/PGC1-α pathways.
Keywords: HepG2 cells; NAFLD; Phellinus linteus; SIRT1/AMPK/PGC1-α pathway; hepatic steatosis; oil droplet accumulation.
Conflict of interest statement
The authors declare no conflict of interest.
Figures
Similar articles
-
Oxymatrine relieves non-alcoholic fatty liver disease by promoting sirtuin 1/adenosine 5'-monophosphate-activated protein kinase pathway and peroxisome proliferator activated receptor alpha-mediated hepatic fatty acid oxidation.Eur J Pharmacol. 2025 Jan 15;987:177173. doi: 10.1016/j.ejphar.2024.177173. Epub 2024 Dec 3. Eur J Pharmacol. 2025. PMID: 39637931
-
LB100 ameliorates nonalcoholic fatty liver disease via the AMPK/Sirt1 pathway.World J Gastroenterol. 2019 Dec 7;25(45):6607-6618. doi: 10.3748/wjg.v25.i45.6607. World J Gastroenterol. 2019. PMID: 31832001 Free PMC article.
-
Water Extract of Dolichos lablab Attenuates Hepatic Lipid Accumulation in a Cellular Nonalcoholic Fatty Liver Disease Model.J Med Food. 2016 May;19(5):495-503. doi: 10.1089/jmf.2015.3623. J Med Food. 2016. PMID: 27152979
-
γ-Mangostin Ameliorates Free Fatty Acid-Induced Lipid Accumulation via the SIRT1/LKB1/AMPK Pathway in HepG2 and L02 Cells.J Agric Food Chem. 2019 Dec 18;67(50):13929-13938. doi: 10.1021/acs.jafc.9b05632. Epub 2019 Dec 5. J Agric Food Chem. 2019. PMID: 31674780
-
Free radical biology for medicine: learning from nonalcoholic fatty liver disease.Free Radic Biol Med. 2013 Dec;65:952-968. doi: 10.1016/j.freeradbiomed.2013.08.174. Epub 2013 Aug 29. Free Radic Biol Med. 2013. PMID: 23994574 Review.
Cited by
-
Lactucin ameliorates FFA-induced steatosis in HepG2 cells by modulating mitochondrial homeostasis through the SIRT1/PGC-1α signaling axis.Heliyon. 2024 Oct 26;10(21):e39890. doi: 10.1016/j.heliyon.2024.e39890. eCollection 2024 Nov 15. Heliyon. 2024. PMID: 39524853 Free PMC article.
References
-
- Lazarus J.V., Mark H.E., Anstee Q.M., Arab J.P., Batterham R.L., Castera L., Cortez-Pinto H., Crespo J., Cusi K., Dirac M.A., et al. Advancing the global public health agenda for NAFLD: A consensus statement. Nat. Rev. Gastroenterol. Hepatol. 2022;19:60–78. doi: 10.1038/s41575-021-00523-4. - DOI - PubMed
-
- Chalasani N., Younossi Z., LaVine J.E., Diehl A.M., Brunt E.M., Cusi K., Charlton M., Sanyal A.J. The diagnosis and management of non-alcoholic fatty liver disease: Practice Guideline by the American Association for the Study of Liver Diseases, American College of Gastroenterology, and the American Gastroenterological Association. Hepatology. 2012;55:2005–2023. doi: 10.1002/hep.25762. - DOI - PubMed
MeSH terms
Substances
Supplementary concepts
Grants and funding
LinkOut - more resources
Full Text Sources
Medical
Research Materials
Miscellaneous
