. 2023 Feb 14;24(4):3799.
doi: 10.3390/ijms24043799.

4-Methylumbeliferone Treatment at a Dose of 1.2 g/kg/Day Is Safe for Long-Term Usage in Rats

Affiliations

4-Methylumbeliferone Treatment at a Dose of 1.2 g/kg/Day Is Safe for Long-Term Usage in Rats

Kateřina Štěpánková et al. Int J Mol Sci. .

Abstract

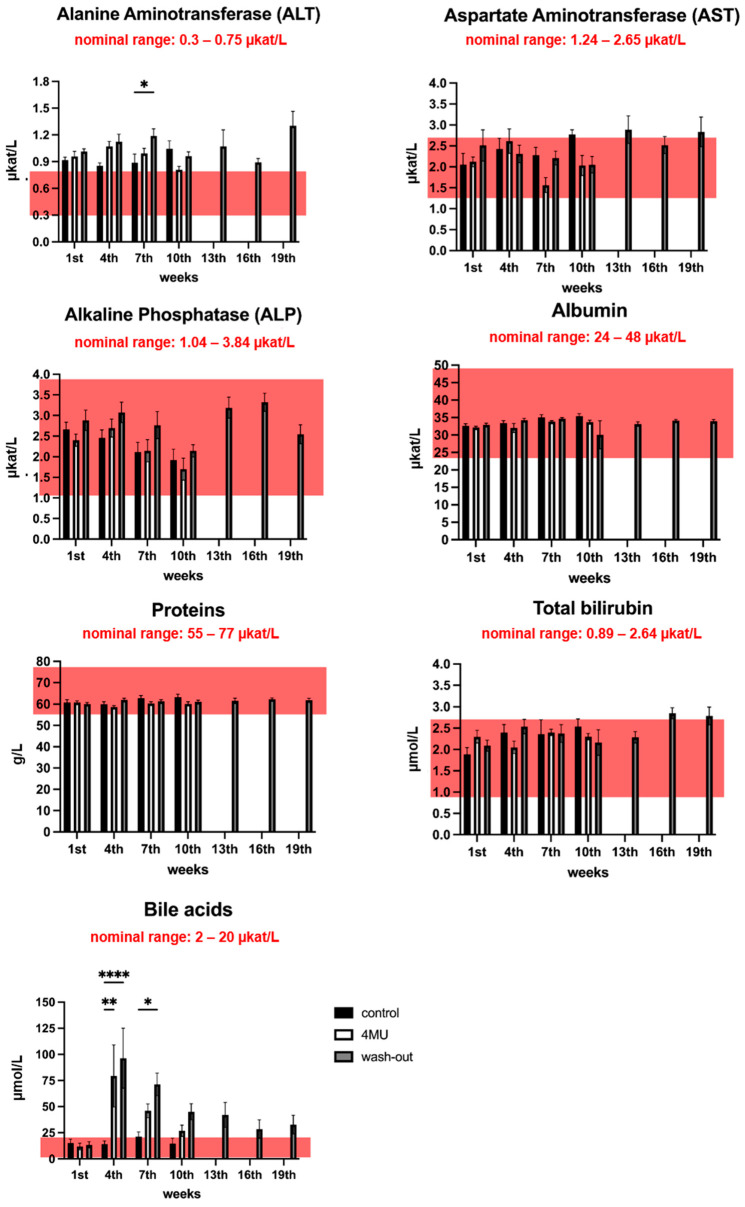
4-methylumbelliferone (4MU) has been suggested as a potential therapeutic agent for a wide range of neurological diseases. The current study aimed to evaluate the physiological changes and potential side effects after 10 weeks of 4MU treatment at a dose of 1.2 g/kg/day in healthy rats, and after 2 months of a wash-out period. Our findings revealed downregulation of hyaluronan (HA) and chondroitin sulphate proteoglycans throughout the body, significantly increased bile acids in blood samples in weeks 4 and 7 of the 4MU treatment, as well as increased blood sugars and proteins a few weeks after 4MU administration, and significantly increased interleukins IL10, IL12p70 and IFN gamma after 10 weeks of 4MU treatment. These effects, however, were reversed and no significant difference was observed between control treated and 4MU-treated animals after a 9-week wash-out period.

Keywords: 4-methylumbelliferone; chondroitin sulphates; hyaluronan; neuroplasticity.


Conflict of interest statement

Kwok has a patent ‘Treatment of Conditions of the Nervous System’ (PCT/EP2020/079979) issued.

Figures

Figure 1
Figure 1
4MU administered at a dose of 1.2 g/kg/day downregulates HA as well as PNNs in brain and spinal cord after 10 weeks of administration. (A) Representative confocal images showing HA- and ACAN-positive areas in brain sections in placebo-fed animals, 4MU-treated animals and animals after 9 weeks of wash-out period. Scale bar: 1000 µm. (B) Representative confocal images showing detail of the brain cortex. In 4MU-treated animals, HA and ACAN positivity is reduced compared to untreated controls and partially returns after the 9 week wash-out period. Scale bar: 50 µm. (C,D) Quantification of ACAN (red) and HABP signal in the brain cortex. The values are the means ± SEM for n = 3 in each group. (E) Representative confocal images showing HA (turquoise)-, ACAN (red)- and DAPI (blue)-positive areas in spinal cord sections in placebo-fed animals, 4MU-treated animals and animals after 9 weeks of wash-out. Scale bar: 200 µm. (F) Representative confocal images showing detail of the spinal ventral horns. In 4MU-treated animals, HA and ACAN positivity is reduced compared to untreated controls and partially returns after 9 weeks of wash-out, as observed in the brain. Scale bar: 50 µm. (G,H) Quantification of ACAN- and HABP-positive signals in spinal grey matter. The values are the means ± SEM; * p < 0.05, ** p < 0.01 by one-way ANOVA with Tukey’s multiple comparisons test, n = 3 in each group. ns: no significance.
Figure 2
Figure 2
4MU administered at a dose of 1.2 g/kg/day leads to downregulation of HA and CSPGs throughout the body. (A) Representative confocal images showing HA- and CSPG-positive areas in (A) liver, scale bar 100 µm, (B) spleen, scale bar 200 µm, and (C) kidney, scale bar 1000 µm, in placebo-fed animals, 4MU-treated animals and animals after 9 weeks of wash-out, indicating downregulation of both markers and the return of signal after 9 weeks of wash-out. (D,E) Quantification of CS-56- and HABP-positive signals in the kidney, spleen and liver sections. The values are the means ± SEM, * p < 0.05, ** p < 0.01, *** p < 0.001 by two-way ANOVA with Tukey’s multiple comparisons test, n = 3 in each group. ns: no significance.
Figure 3
Figure 3
Liver function tests do not indicate any liver damage after long-term 4MU treatment at 1.2 g/kg/day dose. The pink box in each graph indicates the nominal range of the corresponding test. * p < 0.05, ** p < 0.01, **** p < 0.0001 by two-way ANOVA with Tukey’s multiple comparisons test, n = 5 to 7.
Figure 4
Figure 4
Glycosuria and proteinuria show no severe kidney damage after 1.2 g/kg/day of 4MU-treatment. The bar graph shows the level of urinary glucose changes (A) and urinary protein changes (B) during the 4MU treatment. The pink box in each graph indicates the nominal range of the corresponding test. Data are expressed as a mean ± SEM; * p < 0.05, ** p < 0.01 by two-way ANOVA with Tukey’s multiple comparisons test, n = 7.
Figure 5
Figure 5
Urinary biomarkers used to assess the nephrotoxicity. Bar graphs show the level of urinary markers of renal injury. Data are expressed as a mean ± SEM; * p < 0.05 by one-way ANOVA with Tukey’s multiple comparisons test, n = 4 to 7. ns: no significance.
Figure 6
Figure 6
Serological levels of cytokines and interleukins after long-term 4MU treatment. Bar graphs show the level of detected cytokines and interleukins. Data are expressed as a mean ± SEM; * p < 0.05, ** p < 0.01, *** p < 0.001 by one-way ANOVA with Tukey’s multiple comparisons test, n = 5–8. ns: no significance.
Figure 7
Figure 7
The results between placebo, 4MU-treated and wash-out groups did not show any changes in motor functions after 10 weeks of 4MU treatment, but significant difference was observed in the strength of the forelimbs between placebo and wash-out groups. Different color dots are used for easy identification of each data points. Data are expressed as mean ± SEM; * p < 0.05 by one-way ANOVA with Tukey’s multiple comparisons test. ns: no significance.
Figure 8
Figure 8
Relative number of proerythroblasts in the bone marrow. (A) shows the bar graph comparing the relative number of proerythroblasts in 1000 cells in bone marrow per the smear; (B) shows representative images of the bone marrow smear. Black arrows show the proerythroblasts; scale bar: 20 µm; n = 8; *** p < 0.01; **** p < 0.001 by one-way ANOVA with Tukey’s multiple comparisons test. ns: no significance.
Figure 9
Figure 9
Schematic representation showing the diverse biological functions which HA is involved. Created with BioRender.com, Refs. [21,29,32,33,34,35,36,37,38,39,40].

Similar articles

Cited by

References

    1. Klos C., Paumgartner G., Reichen J. Cation-anion gap and choleretic properties of rat bile. Am. J. Physiol. -Endocrinol. Metab. 1979;236:E434. doi: 10.1152/ajpendo.1979.236.4.E434. - DOI - PubMed
    1. Elferink R.P.J.O., Tytgat G.N.J., Groen A.K. The role of mdr2 P-glycoprotein in hepatobiliary lipid transport. FASEB J. 1997;11:19–28. doi: 10.1096/fasebj.11.1.9034162. - DOI - PubMed
    1. Takeda S., Aburada M. The choleretic mechanism of coumarin compounds and phenolic compounds. J. Pharm. 1981;4:724–734. doi: 10.1248/bpb1978.4.724. - DOI - PubMed
    1. Nagy N., Gurevich I., Kuipers H.F., Ruppert S.M., Marshall P.L., Xie B.J., Sun W., Malkovskiy A.V., Rajadas J., Grandoch M., et al. 4-Methylumbelliferyl glucuronide contributes to hyaluronan synthesis inhibition. J. Biol. Chem. 2019;294:7864–7877. doi: 10.1074/jbc.RA118.006166. - DOI - PMC - PubMed
    1. Dubisova J., Burianova J.S., Svobodova L., Makovicky P., Martinez-Varea N., Cimpean A., Fawcett J.W., Kwok J.C., Kubinova S. Oral treatment of 4-methylumbelliferone reduced perineuronal nets and improved recognition memory in mice. Brain Res. Bull. 2022;181:144–156. doi: 10.1016/j.brainresbull.2022.01.011. - DOI - PMC - PubMed

LinkOut - more resources