

Global Responses of Autopolyploid Sugarcane Badila (Saccharum officinarum L.) to Drought Stress Based on Comparative Transcriptome and Metabolome Profiling
- PMID: 36835268
- PMCID: PMC9966050
- DOI: 10.3390/ijms24043856
Global Responses of Autopolyploid Sugarcane Badila (Saccharum officinarum L.) to Drought Stress Based on Comparative Transcriptome and Metabolome Profiling
Abstract
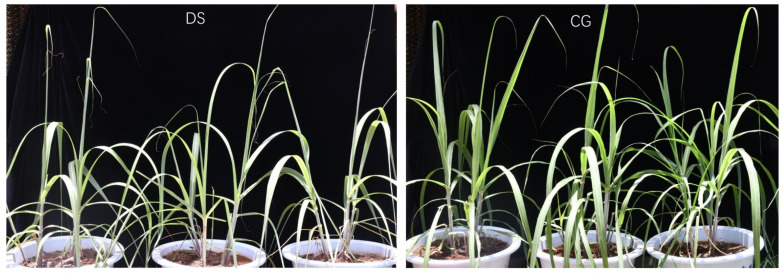
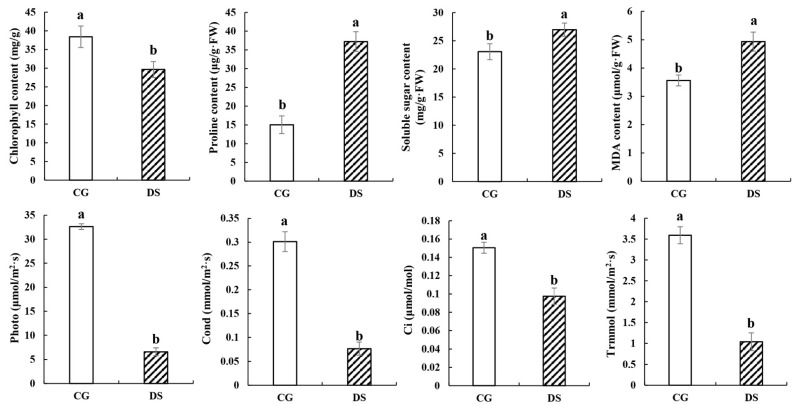
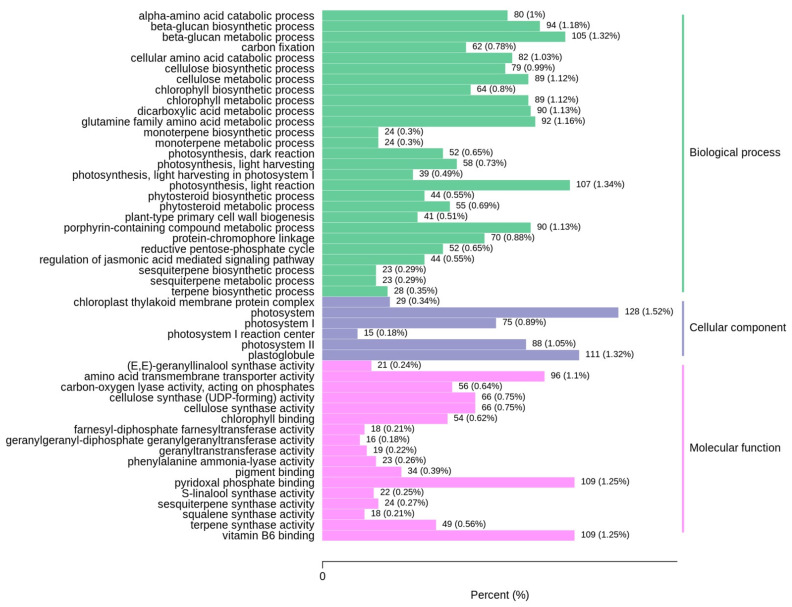
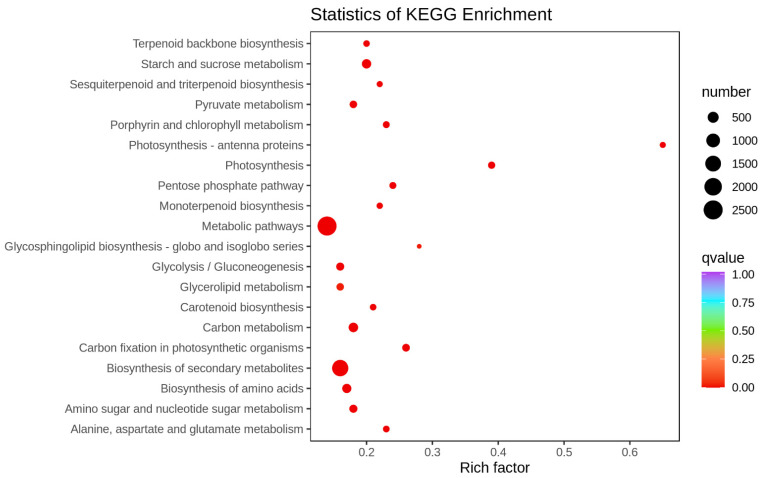
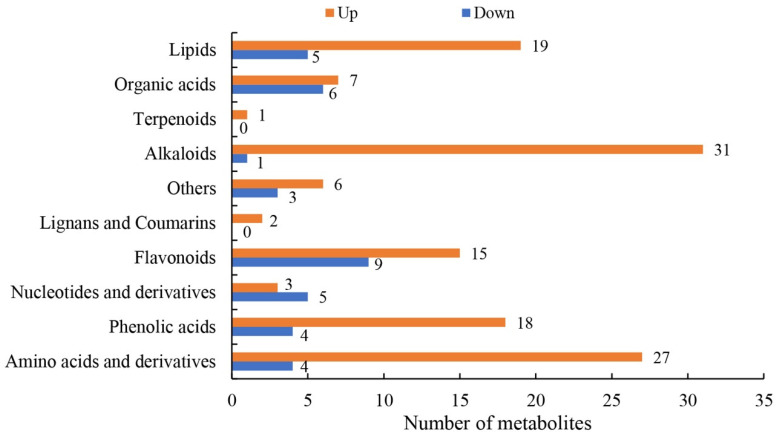
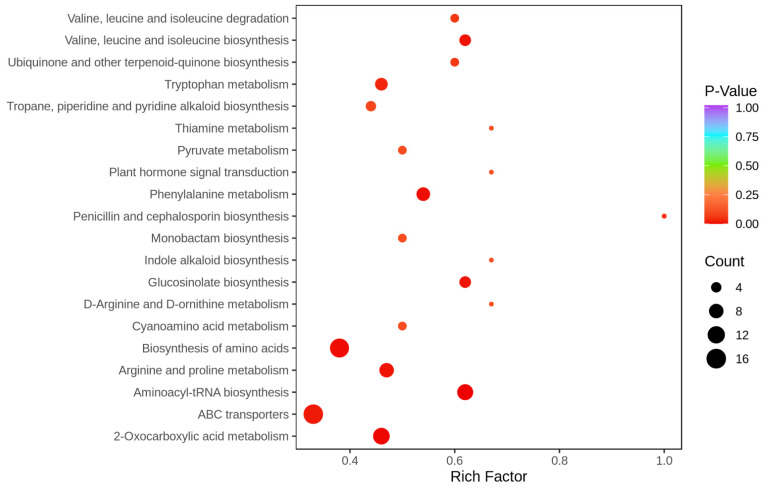
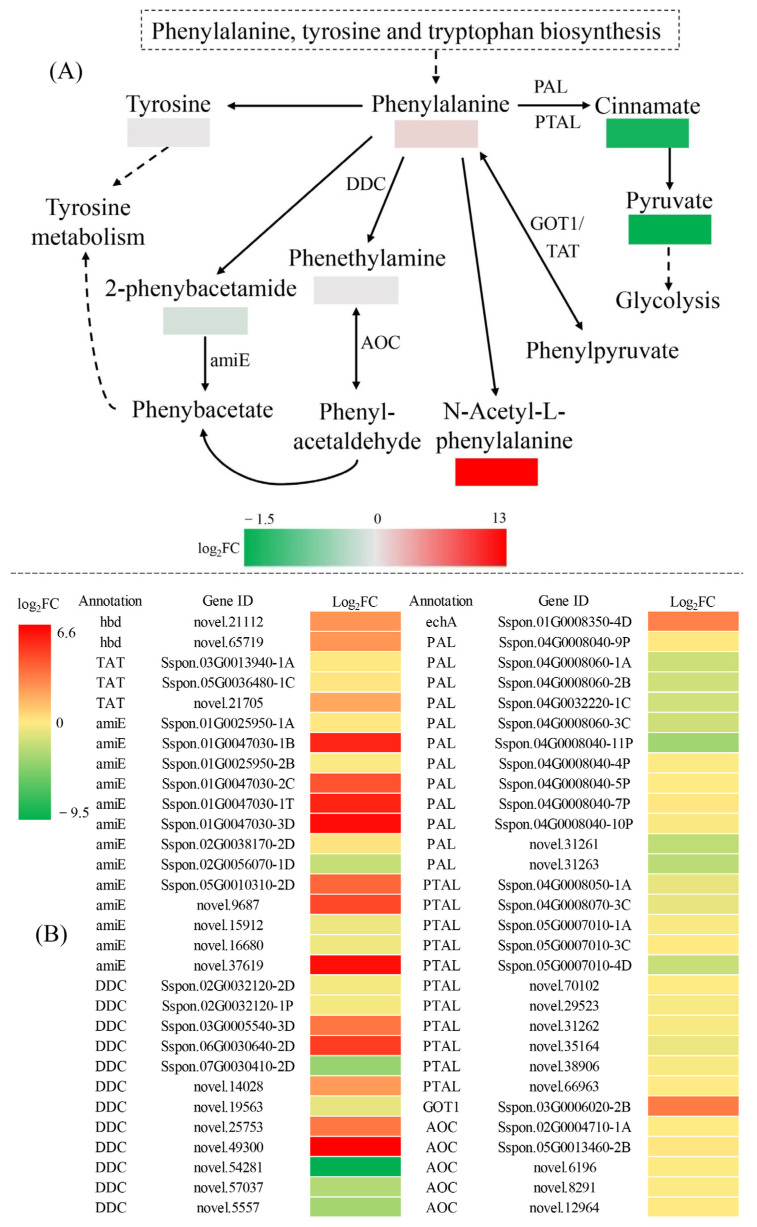
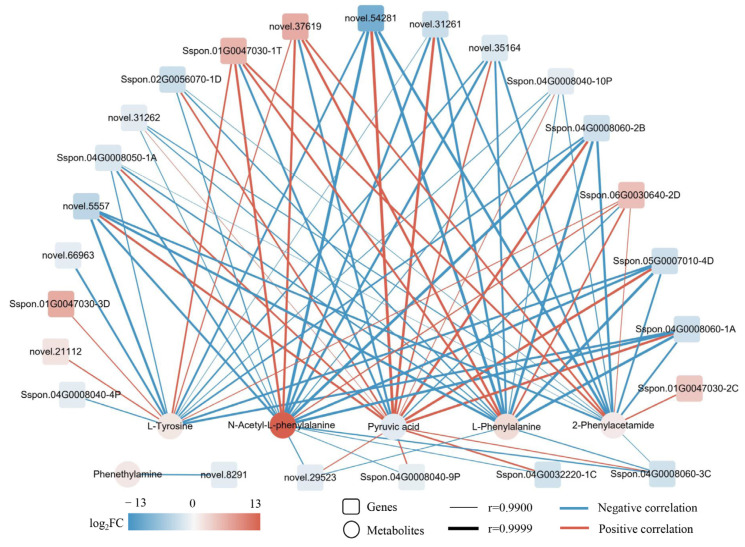
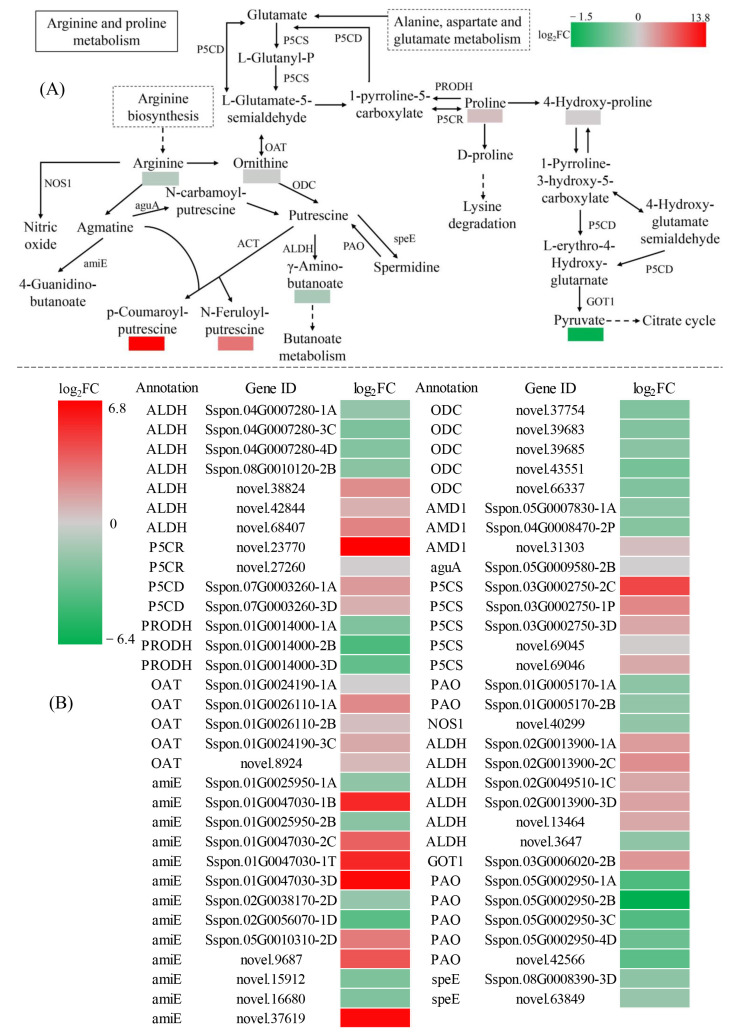
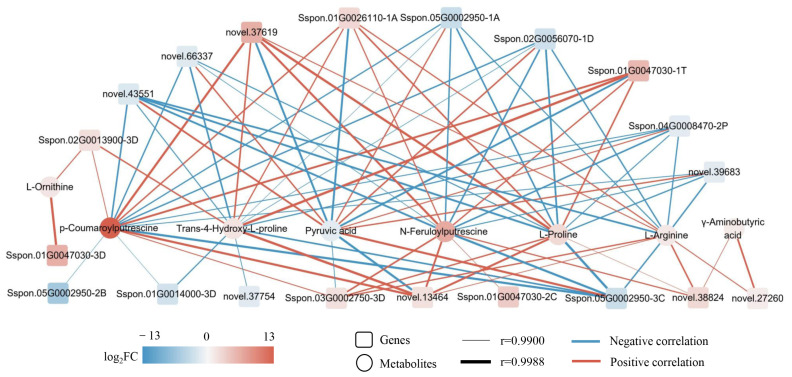
Sugarcane (Saccharum spp. hybrid) is frequently affected by seasonal drought, which causes substantial declines in quality and yield. To understand the drought resistance mechanisms of S. officinarum, the main species of modern sugarcane, at a molecular level, we carried out a comparative analysis of transcriptome and metabolome profiling of the sugarcane variety Badila under drought stress (DS). Compared with control group (CG) plants, plants exposed to DS had 13,744 (6663 up-regulated and 7081 down-regulated) differentially expressed genes (DEGs). GO and KEGG analysis showed that the DEGs were enriched in photosynthesis-related pathways and most DEGs had down-regulated expression. Moreover, the chlorophyll content, photosynthesis (Photo), stomatal conductance (Cond), intercellular carbon dioxide concentration (Ci) and transpiration rate (Trmmol) were sharply decreased under DS. These results indicate that DS has a significant negative influence on photosynthesis in sugarcane. Metabolome analysis identified 166 (37 down-regulated and 129 up-regulated) significantly regulated metabolites (SRMs). Over 50% of SRMs were alkaloids, amino acids and their derivatives, and lipids. The five most significantly enriched KEGG pathways among SRMs were Aminoacyl-tRNA biosynthesis, 2-Oxocarboxylic acid metabolism, Biosynthesis of amino acids, Phenylalanine metabolism, and Arginine and proline metabolism (p < 0.05). Comparing CG with DS for transcriptome and metabolome profiling (T_CG/DS and M_CG/DS, respectively), we found three of the same KEGG-enriched pathways, namely Biosynthesis of amino acids, Phenylalanine metabolism and Arginine and proline metabolism. The potential importance of Phenylalanine metabolism and Arginine and proline metabolism was further analyzed for response to DS in sugarcane. Seven SRMs (five up-regulated and two down-regulated) and 60 DEGs (17 up-regulated and 43 down-regulated) were enriched in Phenylalanine metabolism under DS, of which novel.31261, Sspon.04G0008060-1A, Sspon.04G0008060-2B and Sspon.04G0008060-3C were significantly correlated with 7 SRMs. In Arginine and proline metabolism, eight SRMs (seven up-regulated and one down-regulated) and 63 DEGs (32 up-regulated and 31 down-regulated) were enriched, of which Sspon.01G0026110-1A (OAT) and Sspon.03G0002750-3D (P5CS) were strongly associated with proline (r > 0.99). These findings present the dynamic changes and possible molecular mechanisms of Phenylalanine metabolism as well as Arginine and proline metabolism under DS and provide a foundation for future research and sugarcane improvement.
Keywords: arginine and proline; drought; metabolome; phenylalanine; sugarcane; transcriptome.
Conflict of interest statement
The authors declare no conflict of interest.
Figures
Similar articles
-
Integrated Analysis of Transcriptome and Metabolome Reveals the Regulation of Chitooligosaccharide on Drought Tolerance in Sugarcane (Saccharum spp. Hybrid) under Drought Stress.Int J Mol Sci. 2022 Aug 27;23(17):9737. doi: 10.3390/ijms23179737. Int J Mol Sci. 2022. PMID: 36077135 Free PMC article.
-
Gene Co-Expression Analysis Reveals Transcriptome Divergence between Wild and Cultivated Sugarcane under Drought Stress.Int J Mol Sci. 2022 Jan 5;23(1):569. doi: 10.3390/ijms23010569. Int J Mol Sci. 2022. PMID: 35008994 Free PMC article.
-
Transcriptomic and Metabolomic Profiling of Root Tissue in Drought-Tolerant and Drought-Susceptible Wheat Genotypes in Response to Water Stress.Int J Mol Sci. 2024 Sep 27;25(19):10430. doi: 10.3390/ijms251910430. Int J Mol Sci. 2024. PMID: 39408761 Free PMC article.
-
Transcriptional regulatory networks in response to drought stress and rewatering in maize (Zea mays L.).Mol Genet Genomics. 2021 Nov;296(6):1203-1219. doi: 10.1007/s00438-021-01820-y. Epub 2021 Oct 3. Mol Genet Genomics. 2021. PMID: 34601650 Review.
-
Transcriptome expression profiles reveal response mechanisms to drought and drought-stress mitigation mechanisms by exogenous glycine betaine in maize.Biotechnol Lett. 2022 Mar;44(3):367-386. doi: 10.1007/s10529-022-03221-6. Epub 2022 Mar 16. Biotechnol Lett. 2022. PMID: 35294695 Review.
Cited by
-
Integrated transcriptomic and proteomic analyses of two sugarcane (Saccharum officinarum Linn.) varieties differing in their lodging tolerance.BMC Plant Biol. 2023 Nov 29;23(1):601. doi: 10.1186/s12870-023-04622-z. BMC Plant Biol. 2023. PMID: 38030995 Free PMC article.
-
Extensive targeted metabolomics analysis reveals the identification of major metabolites, antioxidants, and disease-resistant active pharmaceutical components in Camellia tuberculata (Camellia L.) seeds.Sci Rep. 2024 Apr 15;14(1):8709. doi: 10.1038/s41598-024-58725-0. Sci Rep. 2024. PMID: 38622262 Free PMC article.
-
Characterization of Two-Component System gene (TCS) in melatonin-treated common bean under salt and drought stress.Physiol Mol Biol Plants. 2023 Nov;29(11):1733-1754. doi: 10.1007/s12298-023-01406-5. Epub 2023 Dec 23. Physiol Mol Biol Plants. 2023. PMID: 38162914 Free PMC article.
-
Morpho-physio-biochemical and gene expression profiling of drought-tolerant sugarcane genotypes (Saccharum hybrids).Mol Biol Rep. 2025 May 25;52(1):504. doi: 10.1007/s11033-025-10592-2. Mol Biol Rep. 2025. PMID: 40413679
References
-
- Singhal P., Jan A.T., Azam M., Haq Q.M.R. Plant abiotic stress: A prospective strategy of exploiting promoters as alternative to overcome the escalating burden. Front. Life Sci. 2016;9:52–63. doi: 10.1080/21553769.2015.1077478. - DOI
-
- Ferreira T.H.S., Tsunada M.S., Bassi D., Araújo P., Mattiello L., Guidelli G.V., Righetto G.L., Gonçalves V.R., Lakshmanan P., Menossi M. Sugarcane water stress tolerance mechanisms and its implications on developing biotechnology solutions. Front. Plant Sci. 2017;8:1077. doi: 10.3389/fpls.2017.01077. - DOI - PMC - PubMed
MeSH terms
Substances
Grants and funding
LinkOut - more resources
Full Text Sources
Miscellaneous
