. 2023 Feb 15;24(4):3933.
doi: 10.3390/ijms24043933.

HSPs/STAT3 Interplay Sustains DDR and Promotes Cytokine Release by Primary Effusion Lymphoma Cells

Affiliations

HSPs/STAT3 Interplay Sustains DDR and Promotes Cytokine Release by Primary Effusion Lymphoma Cells

Roberta Gonnella et al. Int J Mol Sci. .

Abstract

Primary effusion lymphoma (PEL) is a rare and aggressive B-cell lymphoma, against which current therapies usually fail. In the present study, we show that targeting HSPs, such as HSP27, HSP70 and HSP90, could be an efficient strategy to reduce PEL cell survival, as it induces strong DNA damage, which correlated with an impairment of DDR. Moreover, as HSP27, HSP70 and HSP90 cross talk with STAT3, their inhibition results in STAT3 de-phosphorylation and. On the other hand, the inhibition of STAT3 may downregulate these HSPs. These findings suggest that targeting HSPs has important implications in cancer therapy, as it can reduce the release of cytokines by PEL cells, which, besides affecting their own survival, could negatively influence anti-cancer immune response.

Keywords: DDR; HSP27; HSP70; HSP90; PEL; STAT3; cytokines.


Conflict of interest statement

The authors declare no conflict of interest.

Figures
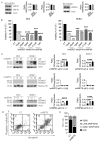
Figure 1
Figure 1
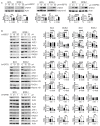
Inhibitors of HSPs strongly impair PEL survival. (A) Protein expression levels of HSP27, HSP70 and HSP90 were evaluated by Western blot analysis in BC3 and BCBL1. Actin was used as a loading control and one representative experiment is shown. The histograms represent the densitometric analysis of the ratio of specific protein/actin. Data are represented as the mean plus S.D. BC3 and BCBL1 cells were treated with inHSP27 (J2) (10–20 µM), inHSP70 (PES) (10–20 µM) or inHSP90 (17AAG) (0.1–1 µM) for 24 h and (B) cell survival was evaluated by a trypan blue exclusion assay. The histograms represent the mean of the percentage of cell viability relative to the control plus S.D. p value: *** <0.001; **** <0.0001. BC3 and BCBL1 cells were treated with inHSP27 (10–20 µM), inHSP70 (10–20 µM) or inHSP90 (0.1–1 µM) for 24 h and (C) protein expression levels of cleaved caspase-3 (ClCasp3) were evaluated by Western blot analysis. Actin or histone H3 was used as a loading control and one representative experiment is shown. The histograms represent the densitometric analysis of the ratio of specific protein/actin or histone H3. Data are represented as the mean plus S.D. p value: ** <0.01; *** <0.001; **** <0.0001. BC3 cells were treated with inHSP70 (20 µM) for 6 h, then double-stained with annexin V/PI and analyzed by FACS analysis. (D) One representative experiment for BC3 is shown. (E) The histograms represent the mean of percentage of live (annexin-V-negative, PI-negative), early apoptotic (annexin-V-positive, PI-negative), late apoptotic (annexin-V-positive, PI-positive) and dead cells (annexin-V-negative, PI-positive).
Figure 2
Figure 2
HSP inhibition induces DNA damage and DDR molecule downregulation in PEL cells. BC3 and BCBL1 cells were treated with inHSP27 (J2) (10–20 µM), inHSP70 (PES) (10–20 µM) or inHSP90 (17AAG) (0.1–1 µM) for 24 h and (A) protein expression levels of γH2AX were evaluated by Western blot analysis. Actin or histone H3 was used as a loading control and one representative experiment is shown. The histograms represent the densitometric analysis of the ratio of γH2AX/actin or histone H3. Data are represented as the mean plus S.D. p value: ** <0.01; *** <0.001; **** <0.0001. (B) Protein expression levels of ATM, Ku70, APE1, XRCC1, BRCA1 and RAD51 were evaluated by Western blot analysis. Actin or histone H3 was used as a loading control and one representative experiment is shown. The histograms represent the densitometric analysis of the ratio of specific protein/actin or histone H3. Data are represented as the mean plus S.D. p value: * <0.05; ** <0.01; *** <0.001; **** <0.0001.
Figure 3
Figure 3
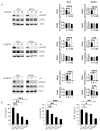
HSP inhibition reduces STAT3 activation and cytokine release in PEL cells. BC3 and BCBL1 cells were treated with inHSP27 (J2) (10–20 µM), inHSP70 (PES) (10–20 µM) or inHSP90 (17AAG) (0.1–1 µM) for 24 h and (A) protein phosphorylation of STAT3 was evaluated by Western blot analysis. Actin was used as a loading control and one representative experiment is shown. The histograms represent the densitometric analysis of the ratio of specific protein/actin. Data are represented as the mean plus S.D. p value: ** <0.01; *** <0.001; **** <0.0001. (B) After treatment with inHSP27 (10 µM), inHSP70 (10 µM) or inHSP90 (0.1 µM), supernatants from BC3 were collected and analyzed for IL-6, IL-10 and VEGF amount by a Luminex Assay. Histograms representing the mean ± S.D. of the three independent experiments. p-value: * <0.05; ** <0.01; *** <0.001.
Figure 4
Figure 4
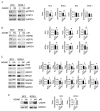
STAT3 inhibition downregulates HSPs and DDR expression and induces DNA damage in PEL cells. BC3 and BCBL1 cell lines were treated with AG490 (100 µM) for 24 h and (A) protein phosphorylation of STAT3 was evaluated by Western blot analysis. GAPDH was used as a loading control and one representative experiment is shown. The histograms represent the densitometric analysis of the ratio of specific protein/GAPDH. Data are represented as the mean plus S.D. p value: * <0.05. (B) Protein expression levels of HSP27, HSP70 and HSP90 were evaluated by Western blot analysis. GAPDH was used as a loading control and one representative experiment is shown. The histograms represent the densitometric analysis of the ratio of specific protein/GAPDH. Data are represented as the mean plus S.D. p value: * <0.05. (C) Protein expression levels of ATM, XRCC1, Ku70, BRCA1 and RAD51 were evaluated by Western blot analysis. GAPDH was used as a loading control and one representative experiment is shown. The histograms represent the densitometric analysis of the ratio of specific protein/GAPDH. Data are represented as the mean plus S.D. p value: * <0.05. (D) Protein expression levels of γH2AX were evaluated by Western blot analysis. GAPDH was used as a loading control and one representative experiment is shown. The histograms represent the densitometric analysis of the ratio of γH2AX/GAPDH. Data are represented as the mean plus S.D. p value: * <0.05.
Figure 5
Figure 5
HSP or STAT3 inhibitors potentiate the cytotoxic effect of PARP inhibitor AZD2461 in PEL cells, by inducing stronger DNA damage. BC3 cell lines were treated with inHSP27 (J2) (10 µM), inHSP70 (PES) (10 µM), inHSP90 (17AAG) (0.1 µM) or AG490 (100 µM) singly or in combinations with AZD2461 (40 μM) for 24 h and (A,B) cell survival was evaluated by a trypan blue exclusion assay. The histograms represent the mean of the percentage of cell viability relative to the control plus S.D. p value: * <0.05; ** <0.01; *** <0.001; **** <0.0001. By calculating the KERN index, the cytotoxic effect, induced by all combinations, was found to be additive (R = 1). (C,D) Protein expression levels of cleaved PARP (ClPARP) and γH2AX were evaluated by Western blot analysis. Actin or GAPDH was used as a loading control and one representative experiment is shown. The histograms represent the densitometric analysis of the ratio of specific protein/actin or protein/GAPDH. Data are represented as the mean plus S.D. p value: * <0.05; ** <0.01; *** <0.001; **** <0.0001. ns = not significant.

Similar articles

Cited by

References

    1. Aoki Y., Feldman G.M., Tosato G. Inhibition of STAT3 signaling induces apoptosis and decreases survivin expression in primary effusion lymphoma. Blood. 2003;101:1535–1542. doi: 10.1182/blood-2002-07-2130. - DOI - PubMed
    1. Bhatt A.P., Bhende P.M., Sin S.H., Roy D., Dittmer D.P., Damania B. Dual inhibition of PI3K and mTOR inhibits autocrine and paracrine proliferative loops in PI3K/Akt/mTOR-addicted lymphomas. Blood. 2010;115:4455–4463. doi: 10.1182/blood-2009-10-251082. - DOI - PMC - PubMed
    1. Gonnella R., Zarrella R., Santarelli R., Germano C.A., Gilardini Montani M.S., Cirone M. Mechanisms of Sensitivity and Resistance of Primary Effusion Lymphoma to Dimethyl Fumarate (DMF) Int. J. Mol. Sci. 2022;23:6773. doi: 10.3390/ijms23126773. - DOI - PMC - PubMed
    1. Granato M., Chiozzi B., Filardi M.R., Lotti L.V., Di Renzo L., Faggioni A., Cirone M. Tyrosine kinase inhibitor tyrphostin AG490 triggers both apoptosis and autophagy by reducing HSF1 and Mcl-1 in PEL cells. Cancer Lett. 2015;366:191–197. doi: 10.1016/j.canlet.2015.07.006. - DOI - PubMed
    1. Ensoli B., Sturzl M., Monini P. Cytokine-mediated growth promotion of Kaposi’s sarcoma and primary effusion lymphoma. Semin. Cancer Biol. 2000;10:367–381. doi: 10.1006/scbi.2000.0329. - DOI - PubMed

MeSH terms