

Starch and Sucrose Metabolism and Plant Hormone Signaling Pathways Play Crucial Roles in Aquilegia Salt Stress Adaption
- PMID: 36835360
- PMCID: PMC9966690
- DOI: 10.3390/ijms24043948
Starch and Sucrose Metabolism and Plant Hormone Signaling Pathways Play Crucial Roles in Aquilegia Salt Stress Adaption
Abstract
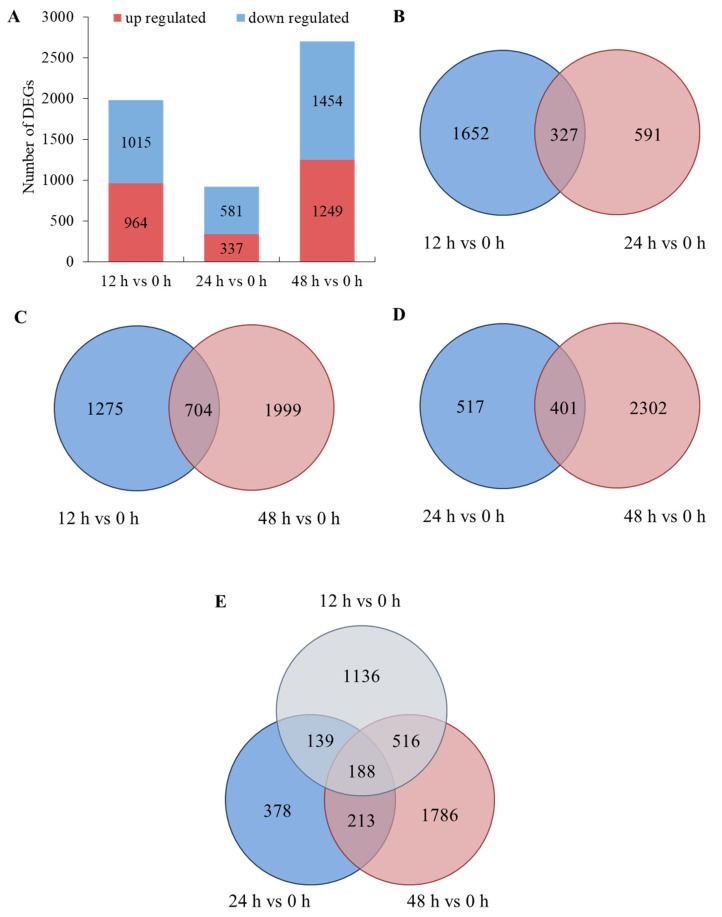
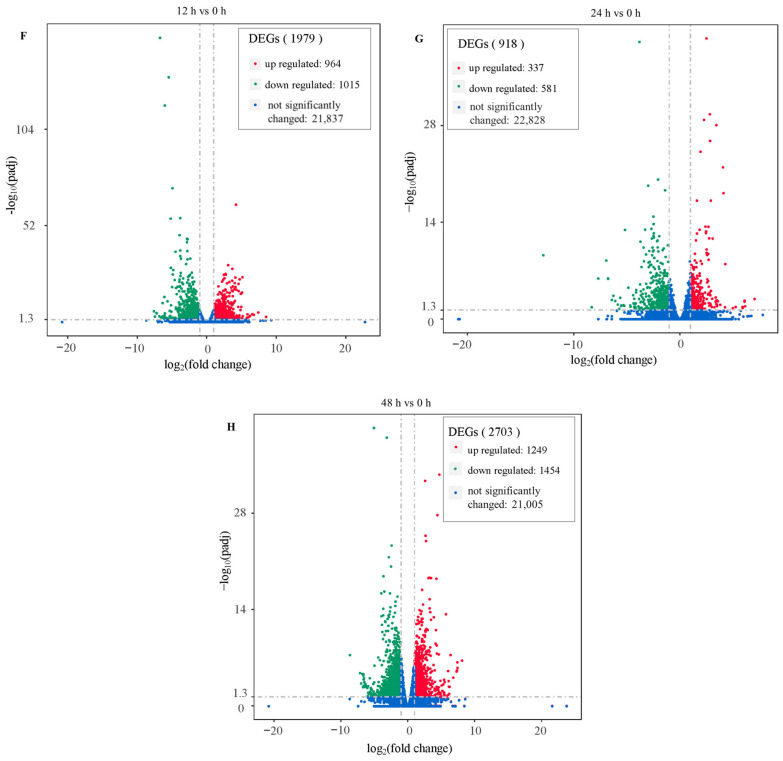
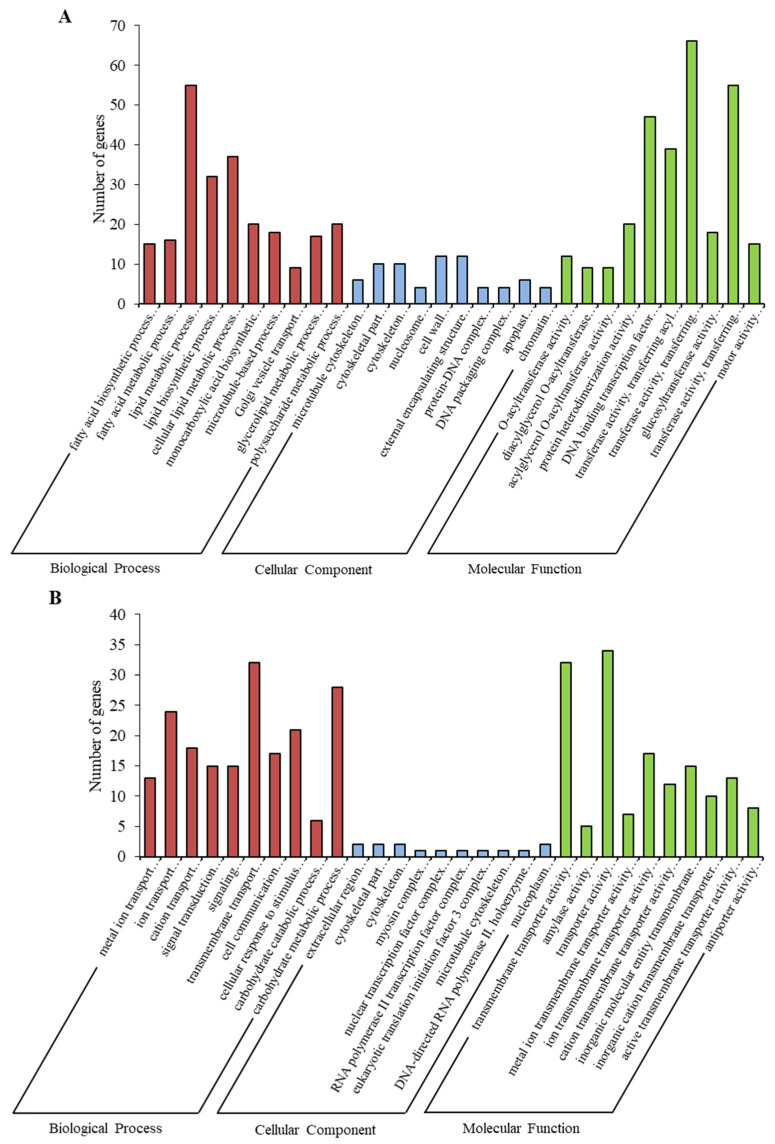
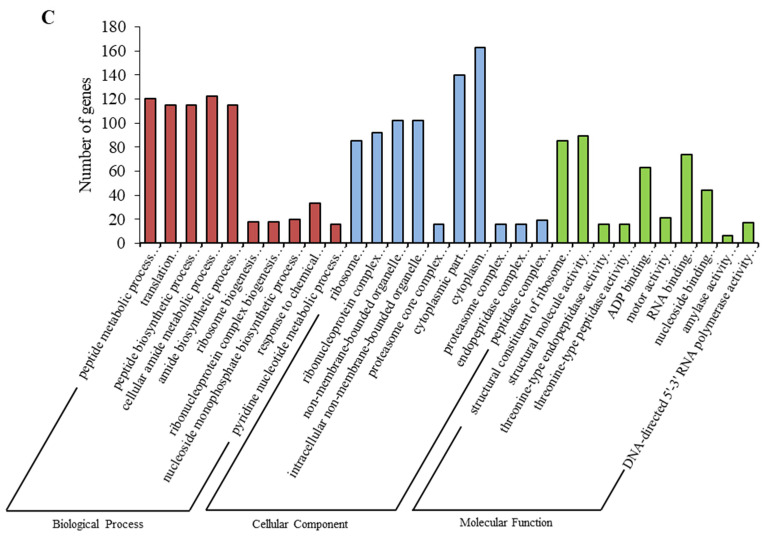
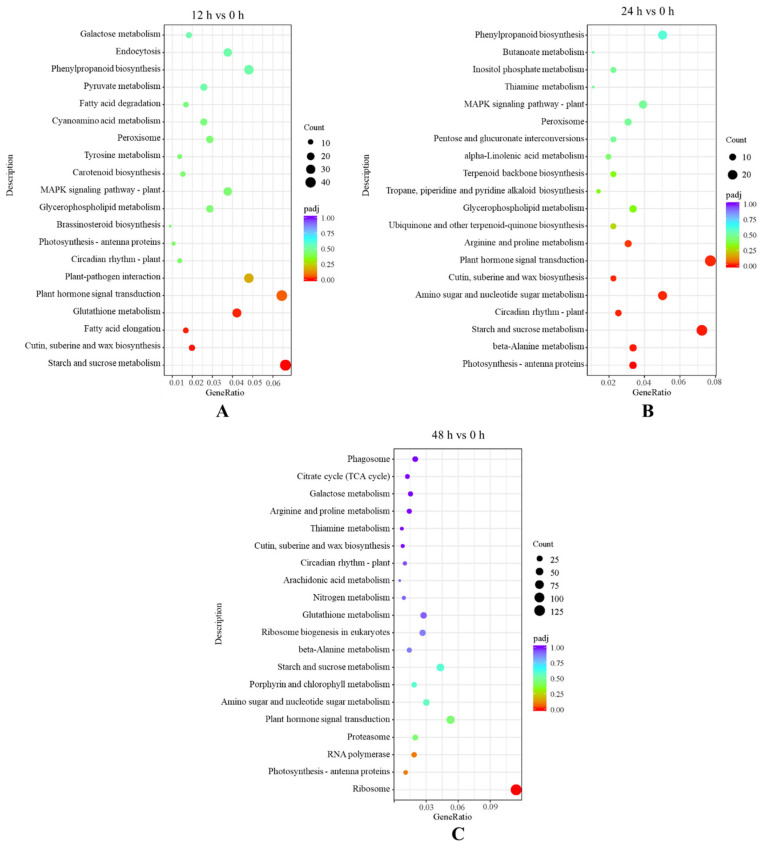
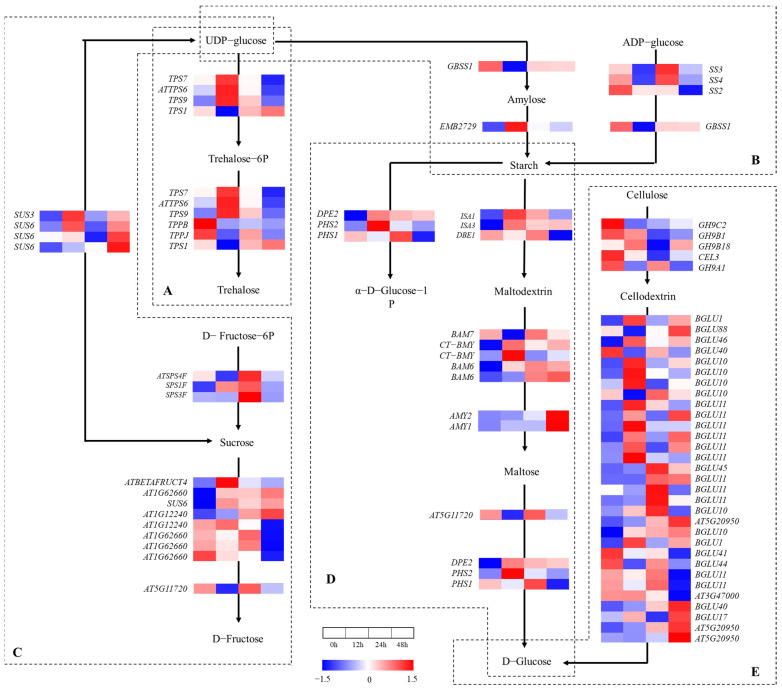
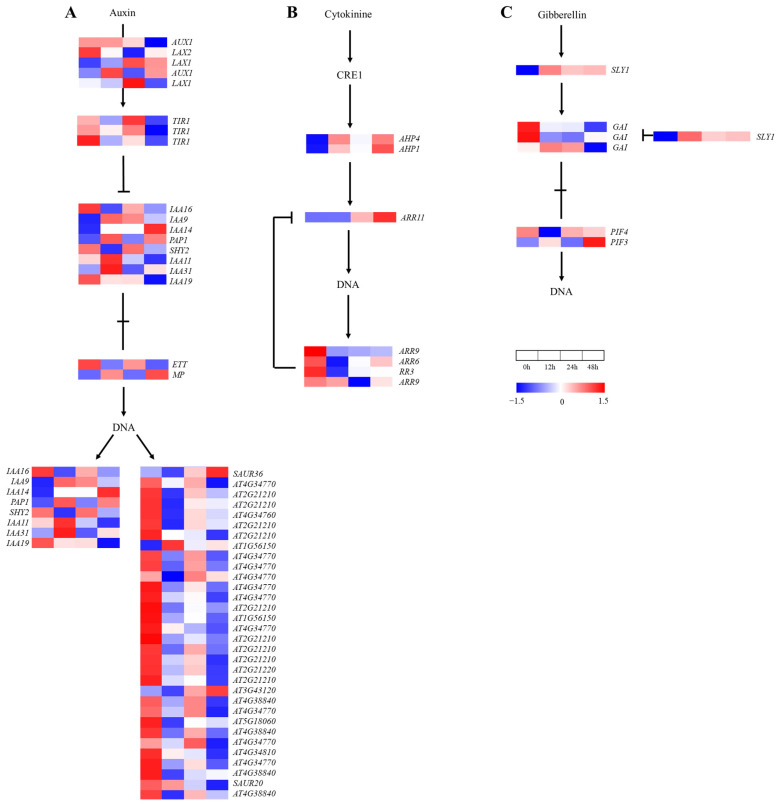
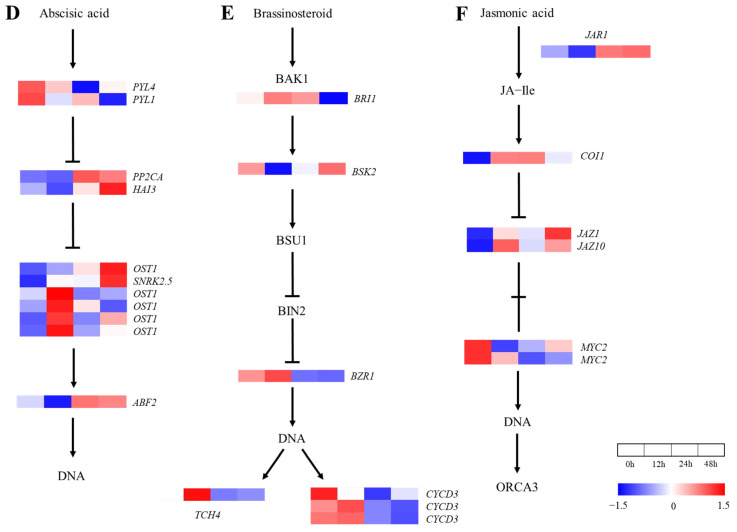
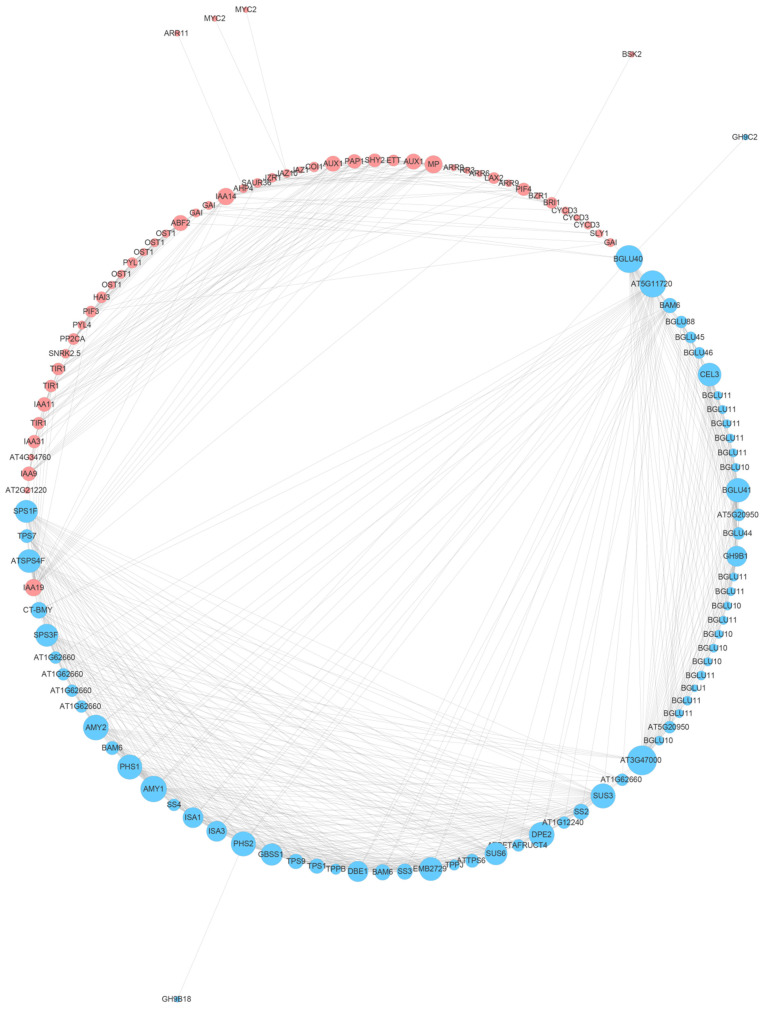
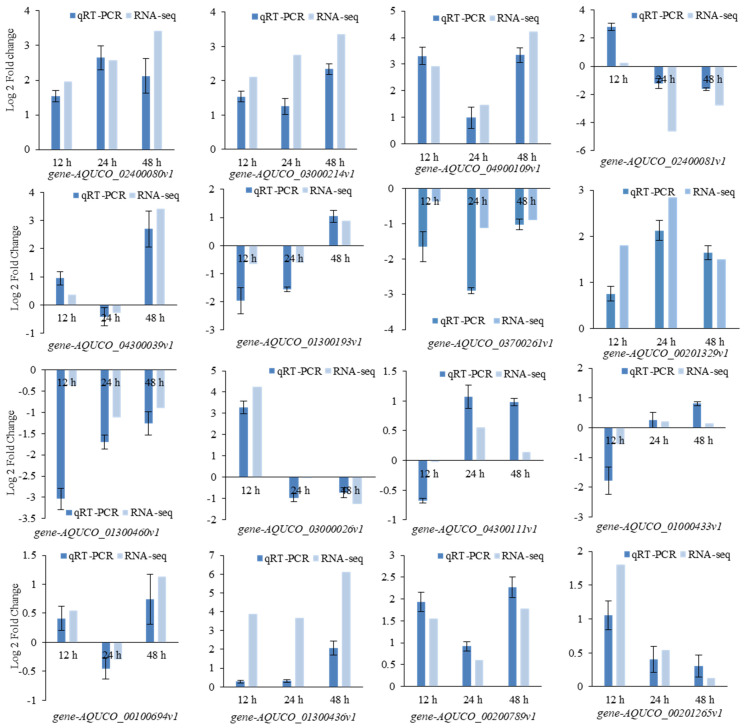
Salt stress is one of the main abiotic stresses that strongly affects plant growth. Clarifying the molecular regulatory mechanism in ornamental plants under salt stress is of great significance for the ecological development of saline soil areas. Aquilegia vulgaris is a perennial with a high ornamental and commercial value. To narrow down the key responsive pathways and regulatory genes, we analyzed the transcriptome of A. vulgaris under a 200 mM NaCl treatment. A total of 5600 differentially expressed genes were identified. The Kyoto Encyclopedia of Genes and Genomes (KEGG) analysis pointed out that starch and sucrose metabolism and plant hormone signal transduction were significantly improved. The above pathways played crucial roles when A. vulgaris was coping with salt stress, and their protein-protein interactions (PPIs) were predicted. This research provides new insights into the molecular regulatory mechanism, which could be the theoretical basis for screening candidate genes in Aquilegia.
Keywords: Aquilegia vulgaris; RNA sequencing; plant hormone signal transduction; salt stress; starch and sucrose metabolism.
Conflict of interest statement
The authors declare no conflict of interest.
Figures
Similar articles
-
Time-Course Transcriptome Analysis of Aquilegia vulgaris Root Reveals the Cell Wall's Roles in Salinity Tolerance.Int J Mol Sci. 2023 Nov 17;24(22):16450. doi: 10.3390/ijms242216450. Int J Mol Sci. 2023. PMID: 38003641 Free PMC article.
-
Transcriptome analysis and differential gene expression profiling of two contrasting quinoa genotypes in response to salt stress.BMC Plant Biol. 2020 Dec 30;20(1):568. doi: 10.1186/s12870-020-02753-1. BMC Plant Biol. 2020. PMID: 33380327 Free PMC article.
-
Full-length transcriptome profiling reveals insight into the cold response of two kiwifruit genotypes (A. arguta) with contrasting freezing tolerances.BMC Plant Biol. 2021 Aug 11;21(1):365. doi: 10.1186/s12870-021-03152-w. BMC Plant Biol. 2021. PMID: 34380415 Free PMC article.
-
Transcriptome and Metabolome Analyses Revealed the Response Mechanism of Sugar Beet to Salt Stress of Different Durations.Int J Mol Sci. 2022 Aug 24;23(17):9599. doi: 10.3390/ijms23179599. Int J Mol Sci. 2022. PMID: 36076993 Free PMC article.
-
Transcriptome analysis of starch and sucrose metabolism across bulb development in Sagittaria sagittifolia.Gene. 2018 Apr 5;649:99-112. doi: 10.1016/j.gene.2018.01.075. Epub 2018 Jan 31. Gene. 2018. PMID: 29374598 Review.
Cited by
-
Comprehensive Evaluation and Transcriptome Analysis Reveal the Salt Tolerance Mechanism in Semi-Wild Cotton (Gossypium purpurascens).Int J Mol Sci. 2023 Aug 16;24(16):12853. doi: 10.3390/ijms241612853. Int J Mol Sci. 2023. PMID: 37629034 Free PMC article.
-
Genome-Wide Identification and Expression Analysis of the Starch Synthase Gene Family in Sweet Potato and Two of Its Closely Related Species.Genes (Basel). 2024 Mar 25;15(4):400. doi: 10.3390/genes15040400. Genes (Basel). 2024. PMID: 38674335 Free PMC article.
-
Widely Targeted Metabolomics Analysis Revealed the Component Differences of Hemerocallis citrina Borani in Different Production Areas of Datong.Foods. 2024 Oct 25;13(21):3404. doi: 10.3390/foods13213404. Foods. 2024. PMID: 39517188 Free PMC article.
-
Fermentative profile and bacterial community structure of whole-plant triticale silage (Triticosecale Wittmack) with or without the addition of Streptococcus bovis and Lactiplantibacillus plantarum.mSphere. 2025 Feb 25;10(2):e0089424. doi: 10.1128/msphere.00894-24. Epub 2025 Jan 28. mSphere. 2025. PMID: 39873502 Free PMC article.
-
Acetylation proteomics and metabolomics analyses reveal the involvement of starch synthase undergoing acetylation modification during UV-B stress resistance in Rhododendron Chrysanthum Pall.Hereditas. 2024 May 3;161(1):15. doi: 10.1186/s41065-024-00320-4. Hereditas. 2024. PMID: 38702800 Free PMC article.
References
-
- Nold R. Columbines: Aquilegia, Paraaquilegia, and Semiaquilegia. Volume 3. Timber Press; Portland, OR, USA: 2003. pp. 124–130.
MeSH terms
Substances
Grants and funding
LinkOut - more resources
Full Text Sources
