. 2023 Feb 16;24(4):3956.
doi: 10.3390/ijms24043956.

Biophysical Parameters Can Induce Epithelial-to-Mesenchymal Phenotypic and Genotypic Changes in HT-29 Cells: A Preliminary Study

Affiliations

Biophysical Parameters Can Induce Epithelial-to-Mesenchymal Phenotypic and Genotypic Changes in HT-29 Cells: A Preliminary Study

Judith Pape et al. Int J Mol Sci. .

Abstract

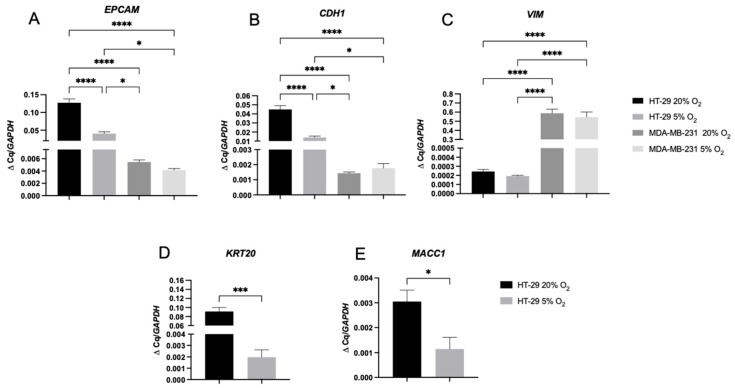
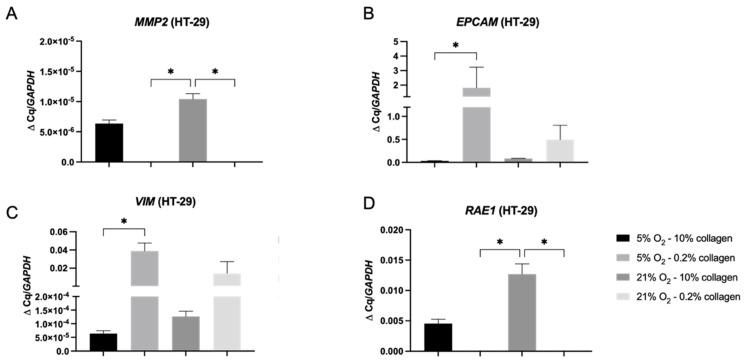
Epithelial to mesenchymal transition (EMT) in cancer is the process described where cancer epithelial cells acquire mesenchymal properties which can lead to enhanced invasiveness. Three-dimensional cancer models often lack the relevant and biomimetic microenvironment parameters appropriate to the native tumour microenvironment thought to drive EMT. In this study, HT-29 epithelial colorectal cells were cultivated in different oxygen and collagen concentrations to investigate how these biophysical parameters influenced invasion patterns and EMT. Colorectal HT-29 cells were grown in physiological hypoxia (5% O2) and normoxia (21% O2) in 2D, 3D soft (60 Pa), and 3D stiff (4 kPa) collagen matrices. Physiological hypoxia was sufficient to trigger expression of markers of EMT in the HT-29 cells in 2D by day 7. This is in contrast to a control breast cancer cell line, MDA-MB-231, which expresses a mesenchymal phenotype regardless of the oxygen concentration. In 3D, HT-29 cells invaded more extensively in a stiff matrix environment with corresponding increases in the invasive genes MMP2 and RAE1. This demonstrates that the physiological environment can directly impact HT-29 cells in terms of EMT marker expression and invasion, compared to an established cell line, MDA-MB-231, which has already undergone EMT. This study highlights the importance of the biophysical microenvironment to cancer epithelial cells and how these factors can direct cell behaviour. In particular, that stiffness of the 3D matrix drives greater invasion in HT-29 cells regardless of hypoxia. It is also pertinent that some cell lines (already having undergone EMT) are not as sensitive to the biophysical features of their microenvironment.

Keywords: 3D model; EMT; collagen; colorectal cancer; hypoxia; tumour microenvironment; tumour stiffness.


Conflict of interest statement

The authors declare no conflict of interest.

Figures

Figure 1
Figure 1
Experimental set up for HT-29 and MDA-MB-231 cells grown in 2D and 3D. For the 2D set up, cells were grown in either 21% or 5% O2 for 7 days and analysed for morphology, invasion and gene expression. For the 3D set up, cells were grown in either 21% or 5% O2 and in either a soft (0.2% collagen) or stiff (10% collagen) matrix for 21 days. After this, the samples were subsequently analysed for morphology and gene expression. Adapted using SMART-Servier Medical ART.
Figure 2
Figure 2
Atomic force microscopy (AFM) of collagen gels with varying collagen concentrations. (A) Casting of collagen gels within a polyetheretherketone (PEEK) ring. (B) Soft hydrogel (0.2% collagen) within petri dish. (C) Plastic compression with RAFTTM absorbers. (D) Stiff plastic-compressed gel (10% collagen) within petri dish. Scale bar = 10 mm for (A,C) and 5 mm for (B,D). (E) Positioning of cantilever with glass bead. Scale bar = 50 µm. (F) Stiffness (Young’s modulus (E), Pa) of acellular 0.2% collagen and 10% collagen gels as measured through AFM. Mann-Whitney significance is shown. All p-value significance is indicated as: **** p < 0.00005.
Figure 3
Figure 3
EMT markers in 2D monolayers of HT-29 and MDA-MB-231 cells cultured within differing oxygen environments. (A) HT-29 cells grown for 7 days in normoxia (21% O2). (B) HT-29 grown for 7 days physiological hypoxia (5% O2). (C) MDA-MB-231 cells grown for 7 days in normoxia (21% O2). (D) MDA-MB-231 cells in physiological hypoxia (5% O2). Red = Phalloidin, EpCAM, or CK20/7; green = Vimentin; blue = DAPI; and scale bar = 50 µm.
Figure 4
Figure 4
EMT gene marker expression within HT-29 and MDA-MB-231 2D monolayers cultured for 7 days in either normoxia (21% O2) or physiological hypoxia (5% O2). mRNA expression of (A) Epithelial cell adhesion marker (EPCAM), (B) E-cadherin (CDH1), (C) Vimentin (VIM), (D) Cytokeratin 20 (KRT20), and (E) Metastasis-associated in colon cancer protein 1 (MACC1). The fold change shown is normalized relative to reference gene glyceraldehyde-3-phosphate dehydrogenase (GAPDH). One-way ANOVA significance with Dunnet’s post hoc correction is shown for VIM, EPCAM, and CDH1 with DOF = 11 for all and F-value = 79.5, 95.3, and 82.6, respectively. Unpaired t-test significance is shown for KRT20 and MACC1 with DOF = 4 for both and t-value= 4.413 and 2.917, respectively. All p-value significance is indicated as: * p < 0.05, *** p < 0.0005, **** p < 0.00005.
Figure 5
Figure 5
Number of invasive bodies and distance of invasion in HT-29 tumouroids with varying stiffness and oxygen concentrations. HT-29 tumouroids showed attached and detached invasive bodies. (A) Total number of attached invasive bodies within HT-29 tumouroids by day 21. (B) Total number of detached invasive bodies within HT-29 tumouroids by day 21. (C) Distance of invasion into the stromal compartment by attached invasive bodies over time within HT-29 tumouroids. (D) Distance of invasion into the stromal compartment by detached invasive bodies over time within HT-29 tumouroids. (E,F) Examples of invasive bodies into the stromal compartment within stiff 10% collagen tumouroids. (G) Example of minimal invasion into the stromal compartment of soft 0.2% collagen. Red = CK20; blue = DAPI; and scale bar = 50 µm for (E); 100 µm for (F); and 500 µm for (G). (H,I) Brightfield images of invasive bodies into the stromal compartment of stiff 10% collagen and (J) 0.2% collagen tumouroids. Scale bar = 100 µm for all. Significance shown for Kruskal–Wallis multiple comparisons test with Dunn’s post hoc correction. All p-value significance is indicated as: ** p < 0.005, *** p < 0.0005, **** p < 0.00005.
Figure 6
Figure 6
Gene expression within HT-29 tumouroids grown in differing collagen and oxygen concentrations. (A) MMP2, (B) EPCAM, (C) VIM, and (D) RAE1 mRNA levels expressed by day 21 in HT-29 tumouroids within stiff (10% collagen) or soft (0.2% collagen) and cultured under physiological hypoxia (5% O2) or normoxia (21% O2). The fold change shown is normalized relative to reference gene GAPDH. Significance shown for Kruskal–Wallis multiple comparisons test with Dunn’s post hoc correction. All p-value significance is indicated as: * p < 0.05.
Figure 7
Figure 7
Quantitative measurements of invasion for MDA-MB-231 cells in 3D with varying stiffness and under differing oxygen concentrations. MDA-MB-231 tumouroids showed attached invasive bodies only within selected regions of interest near the artificial cancer mass (ACM). (A) Total number of attached invasive bodies within MDA-MB-231 tumouroids by day 21. (B) Distance of invasion into the stromal compartment by attached invasive bodies over time within MDA-MB-231 tumouroids. (C) Surface area of invasion of attached invasive bodies within MDA-MB-231 tumouroids. (D) Invasion of cells into stiff 10% collagen tumouroids in a compact sheet formation. (E) Invasion of cells into a soft 0.2% collagen stromal compartment showing a loose phenotype with low cell-to-cell attachment. (F,G) Brightfield images of cells invading as both compact and loose sheets into stiff 10% collagen tumouroids. (H) Cells invaded exclusively as very loose sheets into the soft 0.2% collagen stromal compartment. Red = CK7; green = Vimentin; blue = DAPI; and scale bar = 100 µm for all. Significance shown for Kruskal–Wallis multiple comparisons test with Dunn’s post hoc correction. All p-value significance is indicated as: * p < 0.05, and ** p < 0.005.

Similar articles

Cited by

References

    1. Hieronymus H., Murali R., Tin A., Yadav K., Abida W., Moller H., Berney D., Scher H., Carver B., Scardino P., et al. Tumor copy number alteration burden is a pan-cancer prognostic factor associated with recurrence and death. Elife. 2018;7:e37294. doi: 10.7554/eLife.37294. - DOI - PMC - PubMed
    1. Pillar N., Polsky A.L., Weissglas-Volkov D., Shomron N. Comparison of breast cancer metastasis models reveals a possible mechanism of tumor aggressiveness. Cell Death Dis. 2018;9:1040. doi: 10.1038/s41419-018-1094-8. - DOI - PMC - PubMed
    1. Carter E.P., Roozitalab R., Gibson S.V., Grose R.P. Tumour microenvironment 3D-modelling: Simplicity to complexity and back again. Trends Cancer. 2021;7:1033–1046. doi: 10.1016/j.trecan.2021.06.009. - DOI - PubMed
    1. Micalet A., Moeendarbary E., Cheema U. 3D In Vitro Models for Investigating the Role of Stiffness in Cancer Invasion. ACS Biomater. Sci. Eng. 2021 doi: 10.1021/acsbiomaterials.0c01530. - DOI - PMC - PubMed
    1. Pape J., Emberton M., Cheema U. 3D Cancer Models: The Need for a Complex Stroma, Compartmentalization and Stiffness. Front. Bioeng. Biotechnol. 2021;9:660502. doi: 10.3389/fbioe.2021.660502. - DOI - PMC - PubMed

LinkOut - more resources