. 2023 Feb 16;24(4):4012.
doi: 10.3390/ijms24044012.

The "ON-OFF" Switching Response of Reactive Oxygen Species in Acute Normobaric Hypoxia: Preliminary Outcome

Affiliations

The "ON-OFF" Switching Response of Reactive Oxygen Species in Acute Normobaric Hypoxia: Preliminary Outcome

Simona Mrakic-Sposta et al. Int J Mol Sci. .

Abstract

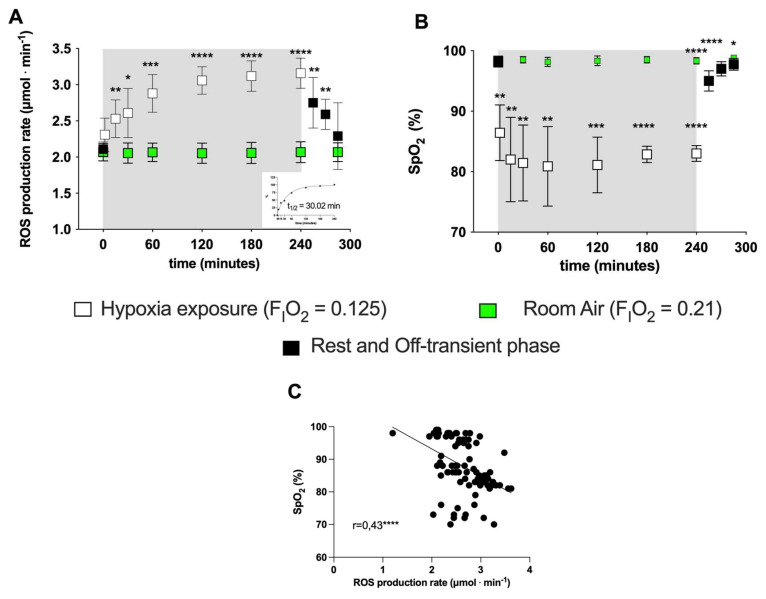
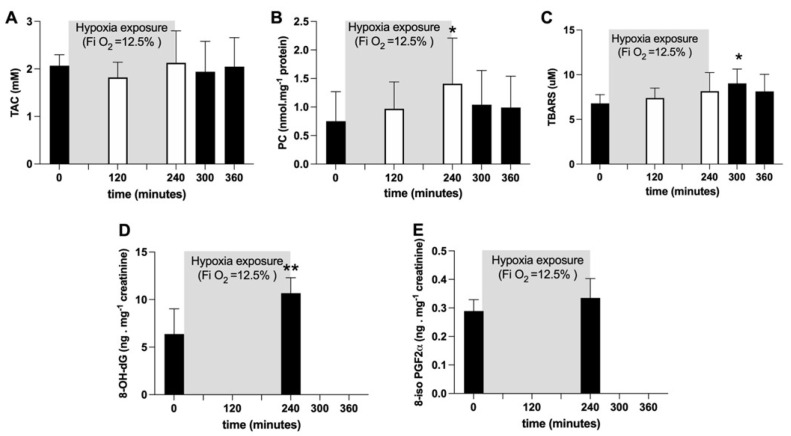
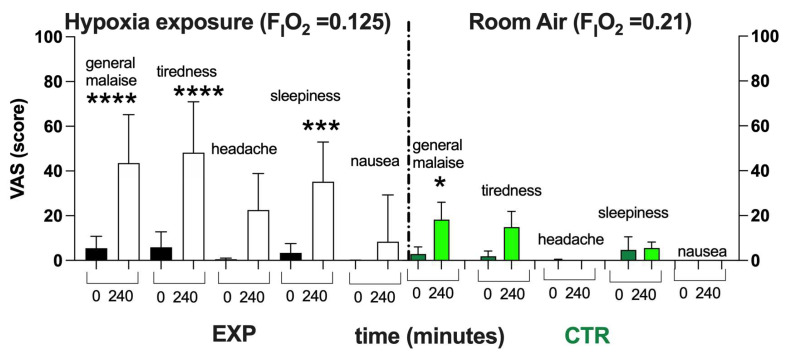
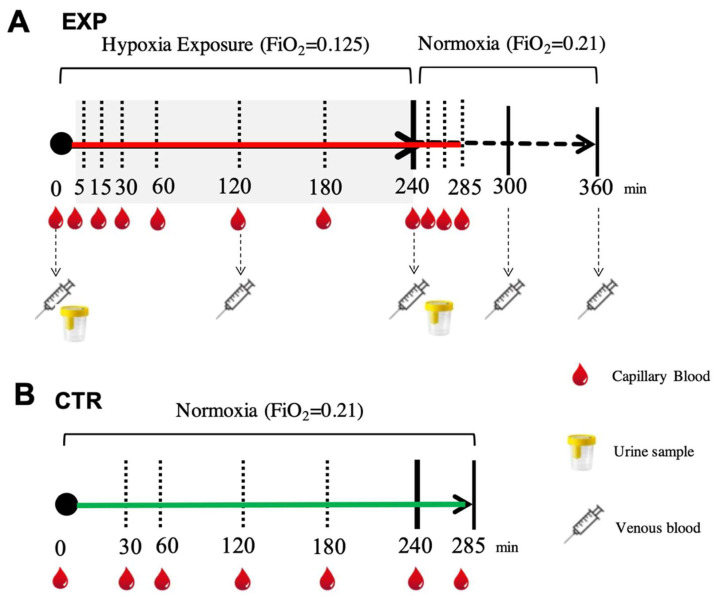
Exposure to acute normobaric hypoxia (NH) elicits reactive oxygen species (ROS) accumulation, whose production kinetics and oxidative damage were here investigated. Nine subjects were monitored while breathing an NH mixture (0.125 FIO2 in air, about 4100 m) and during recovery with room air. ROS production was assessed by Electron Paramagnetic Resonance in capillary blood. Total antioxidant capacity, lipid peroxidation (TBARS and 8-iso-PFG2α), protein oxidation (PC) and DNA oxidation (8-OH-dG) were measured in plasma and/or urine. The ROS production rate (μmol·min-1) was monitored (5, 15, 30, 60, 120, 240 and 300 min). A production peak (+50%) was reached at 4 h. The on-transient kinetics, exponentially fitted (t1/2 = 30 min r2 = 0.995), were ascribable to the low O2 tension transition and the mirror-like related SpO2 decrease: 15 min: -12%; 60 min: -18%. The exposure did not seem to affect the prooxidant/antioxidant balance. Significant increases in PC (+88%) and 8-OH-dG (+67%) at 4 h in TBARS (+33%) one hour after hypoxia offset were also observed. General malaise was described by most of the subjects. Under acute NH, ROS production and oxidative damage resulted in time and SpO2-dependent reversible phenomena. The experimental model could be suitable for evaluating the acclimatation level, a key element in the context of mountain rescues in relation to technical/medical workers who have not had enough time for acclimatization-as, for example, during helicopter flights.

Keywords: ROS; electron paramagnetic resonance; normobaric hypoxia; oxidative stress; simulate altitude.


Conflict of interest statement

The authors declare no conflict of interest.

Figures

Figure 1
Figure 1
(A) Time course of the ROS production rate (μmol·min−1) assessed by EPR technique and (B) SpO2 (%) during the transition from normoxia to acute normobaric hypoxia and back to normoxia during recovery. EXP group: full symbols are the data obtained before (0 min) and 15, 30, 45 min after hypoxia exposure (recovery); open symbols are the data during hypoxia status: at 5, 15, 30, 60, 120, 180, 240 min. Green symbols are the data obtained from the CTR (room air, normoxia state FiO2 = 0.21) for ROS (μmol·min−1) and SpO2 (%). In the inset at the right bottom of Figure A, the exponential fit of the on-transient kinetics data (t1/2 = 30.02 min, r2 = 0.995) is shown. Results are expressed as mean ± SD. (C) Data (full symbols) and linear correlation line (continuous line, r = 0.43) of the ROS production rate versus SpO2. Changes over time were significantly different when compared to pre-exposure levels (* p < 0.05; ** p < 0.01; *** p < 0.001; **** p < 0.0001 symbols).
Figure 2
Figure 2
Histogram plots (mean ± SD) of (A) TAC (mM), (B) TBARS (µM) and (C) PC (nmol·mg−1 protein) concentration levels obtained from plasma samples collected at 0, 120 and 240 min of NH. Data at 60 and 120 min of the recovery time, when breathing normoxic room air, are also shown. (D) 8-OH-dG and (E) 8-iso-PGF2α (ng·mg−1 creatinine) data levels before and after NH. Changes over time were significantly different when compared to pre-exposure levels (* p < 0.05; ** p < 0.01 symbols).
Figure 3
Figure 3
Histogram plot (mean ± SD) of the VAS score from the EXP and CTR. Data obtained Pre- (black and green bars respectively) and after 240 min of NH (white and light green bars, respectively) are shown. Changes over time were significantly different when compared to pre-exposure levels (* p < 0.05; *** p < 0.001; **** p < 0.0001 symbols).
Figure 4
Figure 4
(A) EXP. Experimental timeline adopted for collecting each subject’s blood sample (capillary (red drops), venous (syringes)) to measure ROS production by EPR, oxidative damage (PC and TBARS) by enzymatic assays and urine (glasses) to assess urinary 8-OH-dG and 8-iso-PGF2 alfa by ELISA. (B) CTR. Experimental timeline (continuous green line) adopted for collecting capillary blood samples (red drops) to measure ROS production by EPR.

References

    1. Connett R.J., Honig C.R., Gayeski T.E., Brooks G.A. Defining hypoxia: A systems view of VO2, glycolysis, energetics, and intracellular PO2. J. Appl. Physiol. 1990;68:833–842. doi: 10.1152/jappl.1990.68.3.833. - DOI - PubMed
    1. Bugger H., Pfeil K. Mitochondrial ROS in myocardial ischemia reperfusion and remodeling. Biochim. Biophys. Acta Mol. Basis Dis. 2020;1866:165768. doi: 10.1016/j.bbadis.2020.165768. - DOI - PubMed
    1. Sies H., Jones D.P. Reactive oxygen species (ROS) as pleiotropic physiological signalling agents. Nat. Rev. Mol. Cell Biol. 2020;21:363–383. doi: 10.1038/s41580-020-0230-3. - DOI - PubMed
    1. Joanny P., Steinberg J., Robach P., Richalet J.P., Gortam C., Gardeytye B., Jammes Y. Operation Everest III (Comex’97): The effect of simulated sever hypobaric hypoxia on lipid peroxidation and antioxidant defence systems in human blood at rest and after maximal exercise. Resuscitation. 2001;49:307–314. doi: 10.1016/S0300-9572(00)00373-7. - DOI - PubMed
    1. Smidt M.C., Askew E.W., Roberts D.E.-, Prior R.L., Ensign W.Y., Jr., Hesslink R.E., Jr. Oxidative stress in humans training in a cold, moderate altitude environment and their response to a phytochemical antioxidant supplement. Wilderness Environ. Med. 2002;13:94–105. doi: 10.1580/1080-6032(2002)013[0094:OSIHTI]2.0.CO;2. - DOI - PubMed